


Each month we ask clients to spend a few minutes reading through our newsletter with the goal of raising their investor IQ. October’s Timely Topics commentary focuses on the seasonality strength of the fourth quarter combined with investor anxiety of owning stocks and bonds.
- Stocks vs. bonds
- International update
- Will IPOs recover?
- Housing update
- NSAG news
- Where will the equity markets go next?
Stocks vs. bonds
Clients have increasingly asked about investment opportunities in bonds, and the fixed income markets in general over the past 18 months. The motivation behind each inquiry varies. While bonds have their role in a portfolio, it is important to understand what that role is and to understand the risk and reward associated with this asset class. From an academic level, bonds are used in a portfolio to increase a portfolio’s risk-adjusted returns. From a client’s perspective, bonds are typically used to reduce exposure to volatile stock markets.
In comparison to stocks, bonds generally have lower expected returns and lower expected volatility. Additionally, bonds have a low correlation with stocks in the long run. Adding bonds to a stock portfolio has generally led to an increase in a portfolio’s risk-adjusted return estimates, due to these characteristics. A bond’s risk and return estimates can vary greatly depending on factors such as credit rating, liquidity, duration, etc. While there is higher risk with bonds at the lowest end of the credit rating and liquidity spectrum, these bonds still have lower return expectations than stocks. For this reason, NSAG prefers to use high quality bonds in a portfolio with the goal of meeting future liabilities (e.g., down payment, spending needs in retirement, taxes, etc.) and not with the intent of enhancing portfolio returns since stocks generally do a better job of producing higher risk adjusted returns.
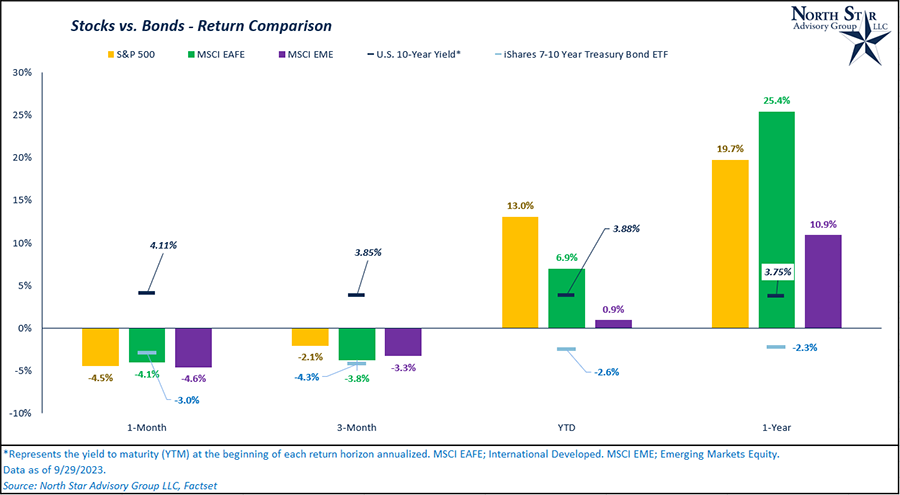
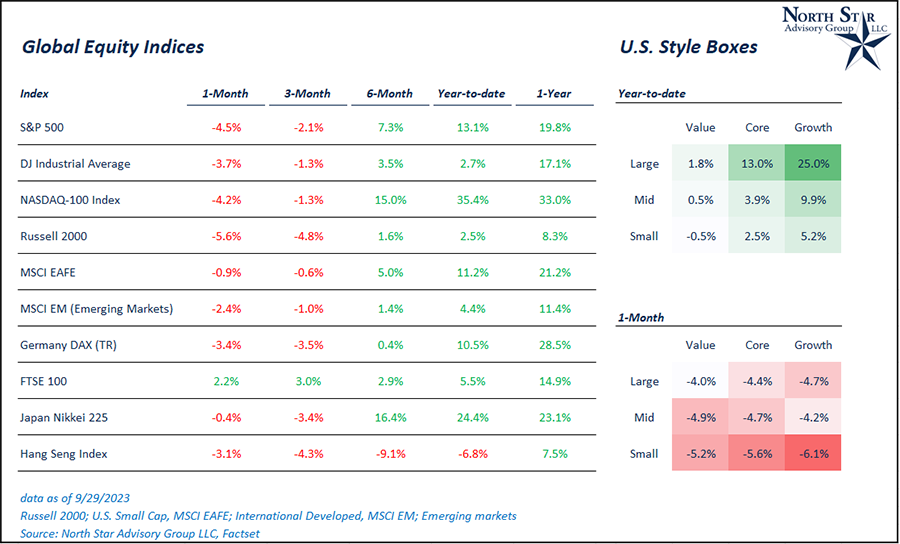
The chart below compares returns for the United States (S&P 500), international (MSCI EAFE Index), and emerging markets (MSCI EME Index) to medium-term treasuries and the yield to maturity on the 10-year treasury. For this exercise, we’ll focus on the 1-year and year-to-date (YTD) return horizons. If we rewind the clock to September 2022, you’ll recall that the stock markets were near their recent bottom, the Fed was aggressively hiking interest rates, and volatility was elevated. Now, one-year later, U.S., international, and emerging stocks are up around 20%, 25%, and 11%, respectively as of 9/29/2023. Each stock index outpaced the -2.3% return on medium-term bonds and was also higher than the 10-year yield at 3.75%. In spite of the relatively high 10-year yield, the actual return for 7–10-year treasury bond ETF was negative over each time period.
Given scenarios like these, we generally encourage investors to take a long-term view with their stock holdings during volatile periods.
International update
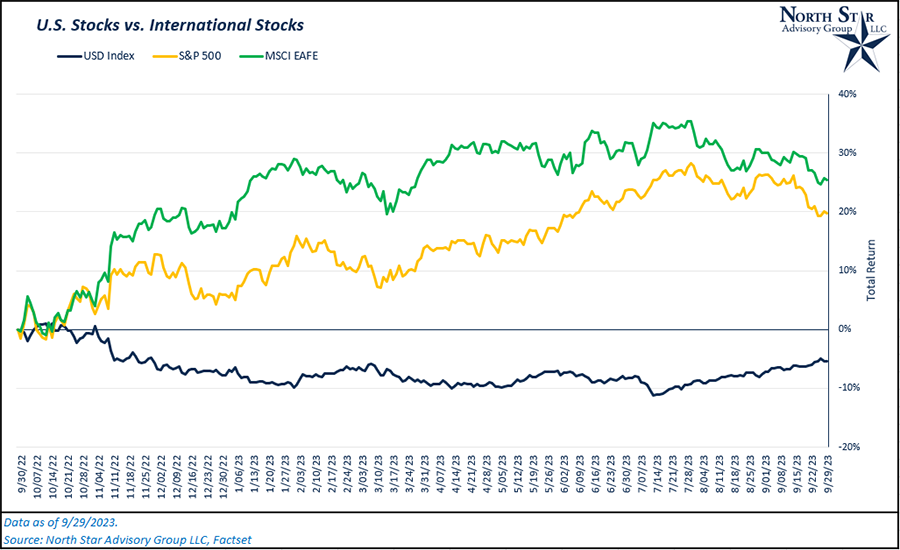
NSAG continues to be constructive on international stocks. Relative to the U.S., valuations for international stocks are at historically low levels. Additionally, a weaker dollar will continue to act as a long-term tailwind for international stocks. For these reasons, NSAG has been encouraging clients to remain diversified over the past year. In the chart below, you’ll see that the international stocks (MSCI EAFE Index in green) are up ~25%, while the United States (S&P 500 in yellow) is up ~20%. Over this same time period, the U.S. Dollar Index is down ~5%.
Over the past year, international stock’s earnings forecast has increased by 6% and the P/E multiple has expanded by 15%. With that being said, the relative valuation discount to the U.S. has remained flat as U.S. companies have also experienced multiple expansion accelerated by the “A.I. craze” during summer 2023.
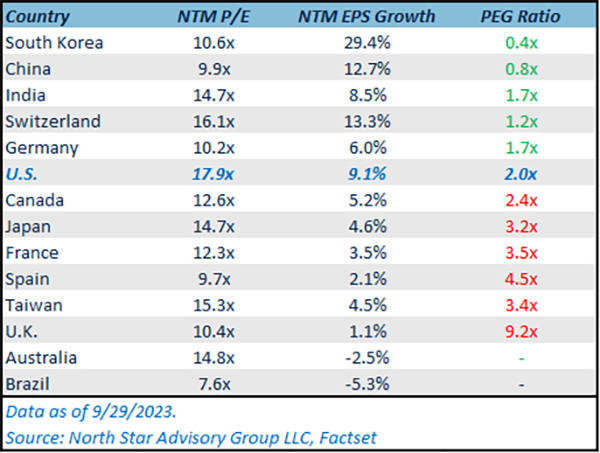
Lastly, there are specific countries that may be currently offering a more attractive valuation relative to the U.S., even when factoring in earnings growth estimates. In the table below, we’ve compared the “PEG” ratio of various countries to the U.S.’s ratio. The “PEG” ratio takes the P/E multiple and divides it by earnings growth estimates, lower ratios are seen as more favorable. While many more factors dictate what constitutes an attractive investment, this comparison is a good way to quickly survey the landscape. South Korea, China, India, Switzerland, and Germany all have lower PEG ratios than the U.S.
IPOs
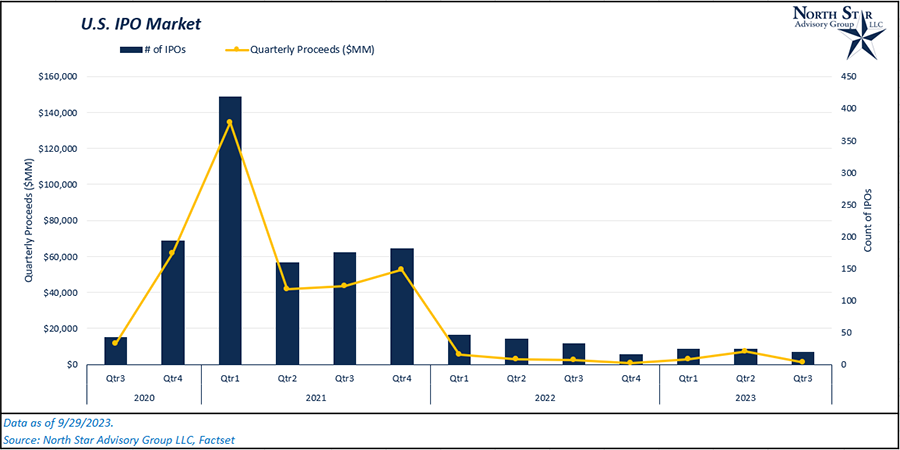
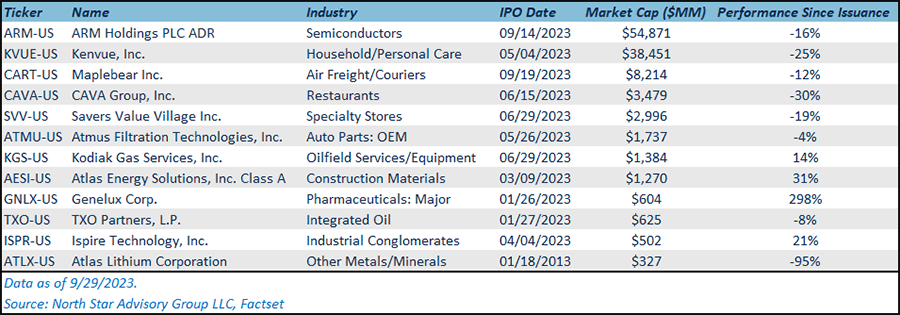
The Initial Public Offering (IPO) market has become relatively non-existent as monetary conditions have tightened significantly from 2021 to 2023. Over the past three years, both the number of IPOs and the average IPO proceeds have significantly decreased. This market has been in desperate need of liquidity.
Over the past few weeks, some notable IPOs began trading on U.S. exchanges, including Instacart (Maplebear, Inc.) and ARM holdings. The performance of these two offerings may serve as an indicator for the IPO market in the U.S. over the next few months. If performance is strong, we may begin seeing some near-term interest in other private companies that are considering going public. While still a bit early to tell, below is the performance for both of these IPOs since their initial listings, as well as other notable IPOs in 2023. By looking at performance, it appears that high profile IPOs have remained out of favor with investors.
Housing update
As interest rates continue to climb, we think it is important to continue keeping an eye on the mortgage market and the impact that it is having on the housing market in general.
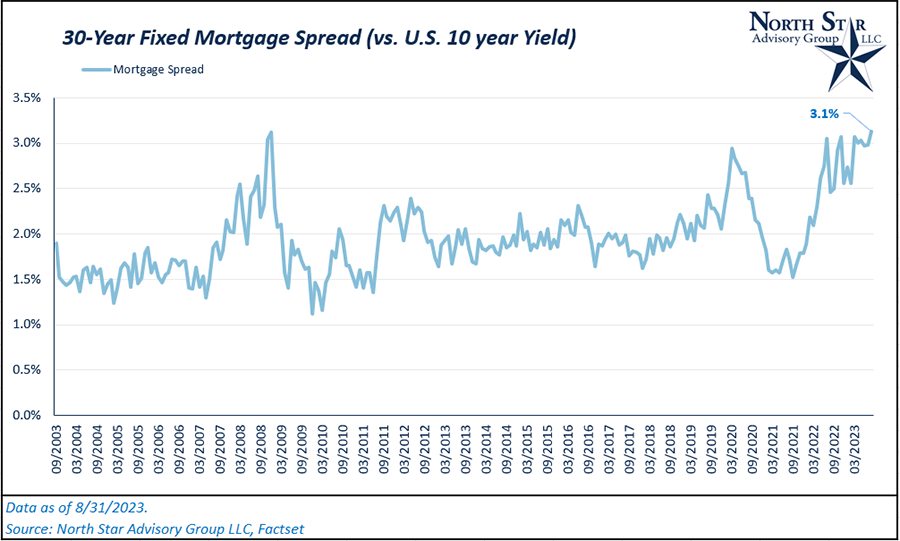
As of 8/31/2023, the current average 30-Year fixed mortgage rate is at 7.22%. Compared to the U.S. 10-Year treasury yield of 4.1%, this implied a mortgage spread of 3.1%. Generally, we don’t see many people use the spread on mortgage rates as an indicator, although it does raise some questions. Like any borrower (corporation or individual), the rate at which you can borrow money depends on how risky of a borrower you are. Corporations have credit ratings from rating agencies such as Standard & Poor’s or Fitch, while individuals have credit scores. Regardless, the riskier of a borrower you are, the higher the cost for borrowing money. In the case of current mortgage spreads, they are at levels not seen since peaking at 3.1% in 2008. On average, this spread is typically ~2%. While some may interpret the current range as, “the consumer is as risky as they were in ’08,” we don’t necessarily see it that way. As discussed in August 2022’s Timely Topics, the majority of existing mortgages have low fixed interest rates from the past 10+ years, there is not an adjustable-rate problem, and mortgage delinquencies are at historical lows. While consumers have spent most of their excess covid-related savings, unemployment remains low and inflation has been decreasing the past couple of months. In our opinion, consumer data does not indicate that mortgage spreads should be this high, and with historically low demand for mortgages through the past 18+ months, we should eventually see this spread compress.
Why haven’t home prices come down with historically low housing market activity over the past 18+ months? Currently, there is a large supply/demand imbalance for housing. There is a low level of new home supply, and a low level of existing home sales as current homeowners with low mortgage rates are reluctant to sell their homes. These factors have led to an extremely undersupplied housing market that has essentially put a “floor” under most home prices. However, recently we have seen larger home price drops in certain areas that saw short-term rapid home valuation appreciation beyond the regional averages.
NSAG news
We felt it would be appropriate to provide insight into a few of September’s hot topics that clients are inquiring about and rewind to our previous coverage on these topics. Please feel free to read or share with family and friends.
- Student loan forgiveness & repayment
- The US government’s Saving on a Valuable Education (SAVE) program was recently announced and has dramatically changed the way families plan for and manage student loans. We encourage all families with student debt or paying for college to have a brief conversation with NSAG to reanalyze if their current plan optimizes the benefits eligible in the new SAVE program.
- You can read more in August 2023’s Timely Topics.
- Avoidable recession?
- Earlier this year while headlines were focused on the potential for a hard recession, NSAG stayed focused on the higher probability likelihood of a soft landing for the economy. In March 2023’s Timely Topics we highlighted a Fed President’s comments that it is possible to avoid a recession. As the Fed prepares to pivot from rate hikes, they are transitioning to maintaining higher rates.
- Higher rates put downward pressure on stock prices
- Two factors have put pressure on stock prices in August and September. First, on 8/01/2023, Fitch (one of the three major rating agencies) downgraded the U.S. debt rating from AAA to AA+. Second, the U.S. Federal Reserve is communicating due to the strength of the U.S. economy, they will likely keep rates higher for longer. Both of these factors have recently caused the U.S. Treasury yields to increase without the Federal Reserve raising rates. You can read more on the treasury yield impact on valuations in September 2021’s Timely Topics.
- Investing for kids
- In May 2023’s Timely Topics, we focused on kids big and small from ages 0-100. For example, NSAG is providing inquiring clients with a free activity book to help children ages 8-12. The book provides kids with 65 engaging activities about saving, investing, and growing their money. There is no catch, we just found a great resource that we would like to share with our clients. Simply call or email to let us know who the book is for, and we will mail out your free copy.
- Investors and their biases
- After two down months, we have noticed that a few “Guardian” clients have started to get anxious. Knowing what type of investor you are may help improve your portfolio’s long-term performance. Read more on this topic in April 2023’s Timely Topics.
Where will the equity markets go next?
September has historically been a weak month and it followed historical trends in 2023. With respect to the four-year presidential cycle, year three is the only time Q3 has been negative. Lastly, the final two weeks of September are historically the second worst two-week period of the year (behind the two weeks following the close on 2/21).
From a market perspective, we looked at a snapshot of how 14 US index ETFs looked at the end of July when the S&P hit its current bull market peak. Every ETF in the group was sitting in overbought territory. Now, every single one, with the exception of the Dow (DIA), is sitting in extreme oversold territory, with the S&P 500 at its most oversold level of the year.
Now, the good news. August and September are over and Q4 is here. With respect to seasonality, Q4 has historically been a strong time of year, and even stronger in year three of the presidential election cycle. Not only that, but when it comes to rolling two-week returns, there is only one day in Q4 when the S&P 500’s average forward two-week return is negative. When it comes to seasonality, the downturn in August and September have followed the historical script very closely. Over the past 20 years, the average monthly return for August and September has been -0.1% and -0.6%, respectively. Now, the bulls hope that the markets continue to follow their seasonality pattern in Q4.
We are passionately devoted to our clients' families and portfolios. Contact us if you know somebody who would benefit from discovering the North Star difference, or if you just need a few minutes to talk. As a small business, our staff appreciates your continued trust and support.
Please continue to send in your questions and see if yours get featured in next month’s Timely Topics.
Best regards,


Mark Kangas, CFP®
CEO, Investment Advisor Representative