

Each month we ask clients to spend a few minutes reading through our newsletter with the goal of raising their investor IQ. Since a few of the topics go into great detail, we encourage you to jump to your area(s) of interest by clicking on the topics below.
- Tax Reform affects all taxpayers
- Treasury yield impact on valuations
- Rising rates impact on growth & value stocks
- Supply, demand & container ship backlog
- NSAG news
- Where will the equity markets go next?
Tax Reform affects all taxpayers
Politicians in Washington have formally proposed numerous changes to federal income tax law. The changes total more than 10,000 pages and will apply to taxable years starting in 2022. They are generally aimed at households with taxable income more than $400,000 and in typical negotiation style, the original request was much higher than the current proposals.
North Star sorted through the proposed amendments to provide the following summary of the areas we felt would be most relevant to our clients.
High Income Individuals Items
- Increase the top two income tax rate brackets to 39.6% (currently at 35% & 37%) This marginal rate applies to married individuals filing jointly with taxable income more than $450,000; to heads of households with taxable income more than $425,000; to unmarried individuals with taxable income more than $400,000. This provision is effective in tax years beginning after December 31, 2021.
- Increase the top capital gains rate to 25% The top capital gains rate (which does not apply to anyone earning less than $400,000) is increased from 20% to 25%. Negotiations are still taking place to determine if this change will take place retroactive to earlier in this year, when the bill is signed or beginning after December 31, 2021.
- Expands the Net Investment Income Tax to capture more income Expands the net investment income tax to cover net income derived in the ordinary course of a trade or business for taxpayers with greater than $400,000 in taxable income (single filer) or $500,000 (joint filer). By closing this gap, all income, be it from wages (currently subject to 3.8% additional tax), investments (currently subject to 3.8% net investment income tax), or earnings from passthrough businesses will be subject to the same amount of tax, for those with higher incomes.
- Limitation on QBI deduction Amends the Qualified Business Income Deduction (QBI or 199A) by setting the maximum allowable deduction at $500,000 in the case of a joint return, $400,000 for an individual return.
- Limitation on Excess Business Losses for Non-corporate Taxpayers Extends the revenue raiser in the American Rescue Plan to permanently disallow business losses beyond the taxpayer’s business income. The provision currently applies until 2027. The change makes the provision permanent.
- Surtax on high-income individuals Imposes a 3% surtax on individuals with adjusted gross income in excess of $5 million. In our opinion, they could simplify this by creating another tax bracket of 42.6% for all income more than $5 million.
- Estate and gift tax exemption reduced to $5 million per person The estate and gift tax exemptions would drop back to $5 million (plus inflation adjustments), down from the current $11.7 million per person. This would mean more families would face the estate and gift tax. This change accelerates the current reduction that was already set to occur in 2026. The effective date of the lower exemption would be for gifts and deaths after December 31, 2021.
- Changes to the treatment of grantor trusts Technical changes would essentially end the use of new grantor trusts. These are effective at getting wealth out of your estate. The proposed change would pull the trust assets back into your estate when you die. This change would take effect on the date of enactment, for trusts created on or after that date.
- Modifications to estate tax valuation rules This provision changes the valuation rules to ignore discounts from partial ownership or lack of control of an asset in determining its value. This rule applies only to assets that are not used in a business. This provision is limited to passive assets, so these discounts are still permitted for family farms and businesses in the same way as current law.
Corporate and International Tax Reforms
- Increase the top tax rate to 26.5% (currently at 21%) Increases the top rate to 26.5%. For very small businesses with income below $400,000, the bill lowers the corporate tax rate to 18%. The 26.5% rate applies only to businesses with income in excess of $5,000,000 (and remains at 21% for businesses below that).
- Tax increase on foreign income Taxes on foreign income is also increasing. Many clients are correct that this change will not directly impact them. However, roughly half of the earnings for the S&P 500 come from overseas and the technology sector has the highest exposure to international revenue. Therefore, we may see a slight drag on future portfolio growth for large cap and large cap tech stocks.
Other Provisions
- Limitation on Back-Door & In-Plan Roth IRA conversions In order to close these so-called “back-door” Roth IRA strategies, the bill eliminates Roth conversions for both IRAs and employer-sponsored plans for single taxpayers (or taxpayers married filing separately) with taxable income over $400,000, married taxpayers filing jointly with taxable income over $450,000, and heads of households with taxable income over $425,000 (all indexed for inflation). This provision applies to distributions, transfers, and contributions made in taxable years beginning after December 31, 2021.
- New Required Minimum Distributions (RMDs) for large account balances If an individual’s combined traditional IRA, Roth IRA and defined contribution retirement account balances generally exceed $10 million at the end of a taxable year, a minimum distribution would be required for the following year. This minimum distribution is only required if the taxpayer’s taxable income is above the thresholds described in the section above (e.g., $450,000 for a joint return). The minimum distribution is generally 50% of the amount by which the individual’s prior year aggregate traditional IRA, Roth IRA and defined contribution account balance exceeds the $10 million limit. In addition, to the extent that the combined balance amount in traditional IRAs, Roth IRAs and defined contribution plans exceeds $20 million, that excess is required to be distributed from Roth IRAs and Roth designated accounts in defined contribution plans up to the lesser of (1) the amount needed to bring the total balance in all accounts down to $20 million or (2) the aggregate balance in the Roth IRAs and designated Roth accounts in defined contribution plans. Once the individual distributes the amount of any excess required under this 100% distribution rule, then the individual is allowed to determine the accounts from which to distribute to satisfy the 50% distribution rule above. This provision is effective tax years beginning after December 31, 2021.
- Modifications to Wash Sale and Disguised Sales rules Includes transactions involving cryptocurrency in these general tax rules, to treat cryptocurrency the same as other financial instruments and to prevent taxpayer abuse of the rules.
- Conservation Easements Closes the loophole for excessive or inappropriate deductions claimed by investors in syndicated conservation easement transactions, restoring the integrity of the federal conservation easement program. This provision denies charitable deduction for contributions of conservation easements by partnerships and other pass-through entities if the amount of the contribution (and therefore the deduction) exceeds 2.5 times the sum of each partner’s adjusted basis in the partnership that relates to the donated property.
- Prohibition of certain investments inside of IRAs To prevent self-dealing, under current law prohibited transaction rules, an IRA owner cannot invest his or her IRA assets in a corporation, partnership, trust, or estate in which he or she has a 50 percent or greater interest. However, an IRA owner can invest IRA assets in a business in which he or she owns, for example, one-third of the business while also acting as the CEO. The bill adjusts the 50 percent threshold to 10 percent for investments that are not tradable on an established securities market, regardless of whether the IRA owner has a direct or indirect interest. The bill also prevents investing in an entity in which the IRA owner is an officer. Further, the bill modifies the rule to be an IRA requirement, rather than a prohibited transaction rule (i.e., in order to be an IRA, it must meet this requirement). This section generally takes effect for tax years beginning after December 31, 2021, but there is a 2-year transition period for IRAs already holding these investments.
Treasury yield impact on valuations
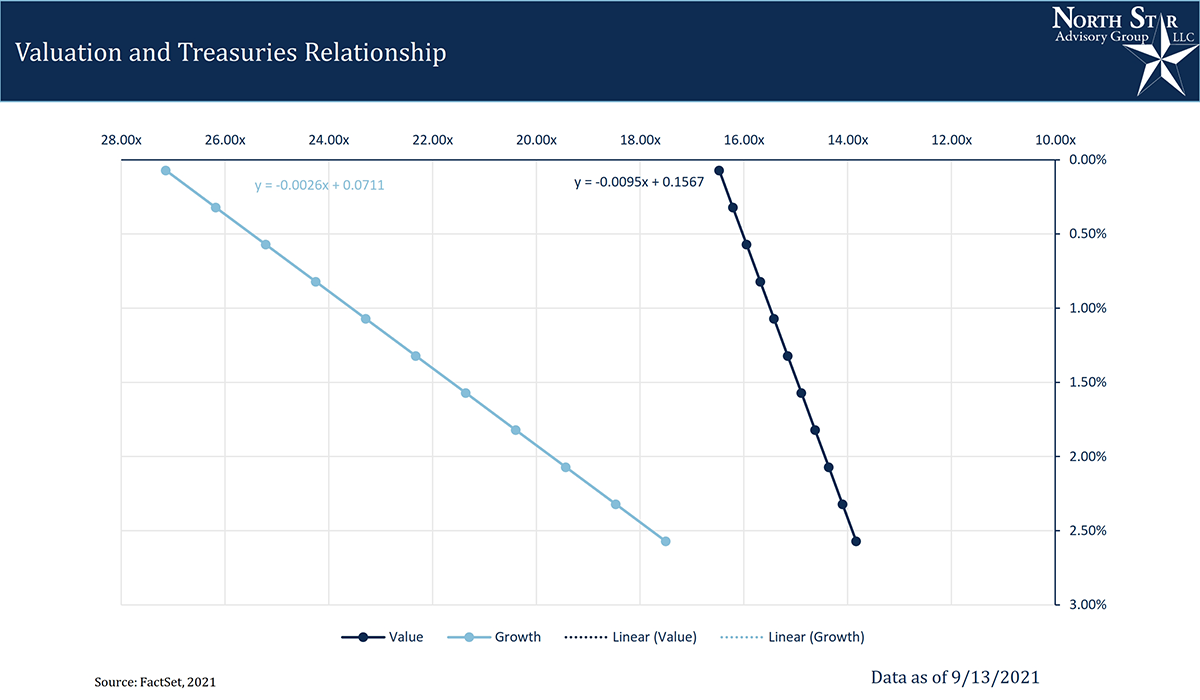
Client question: “What happens to stock valuations (P/E ratios) when interest rates rise?”
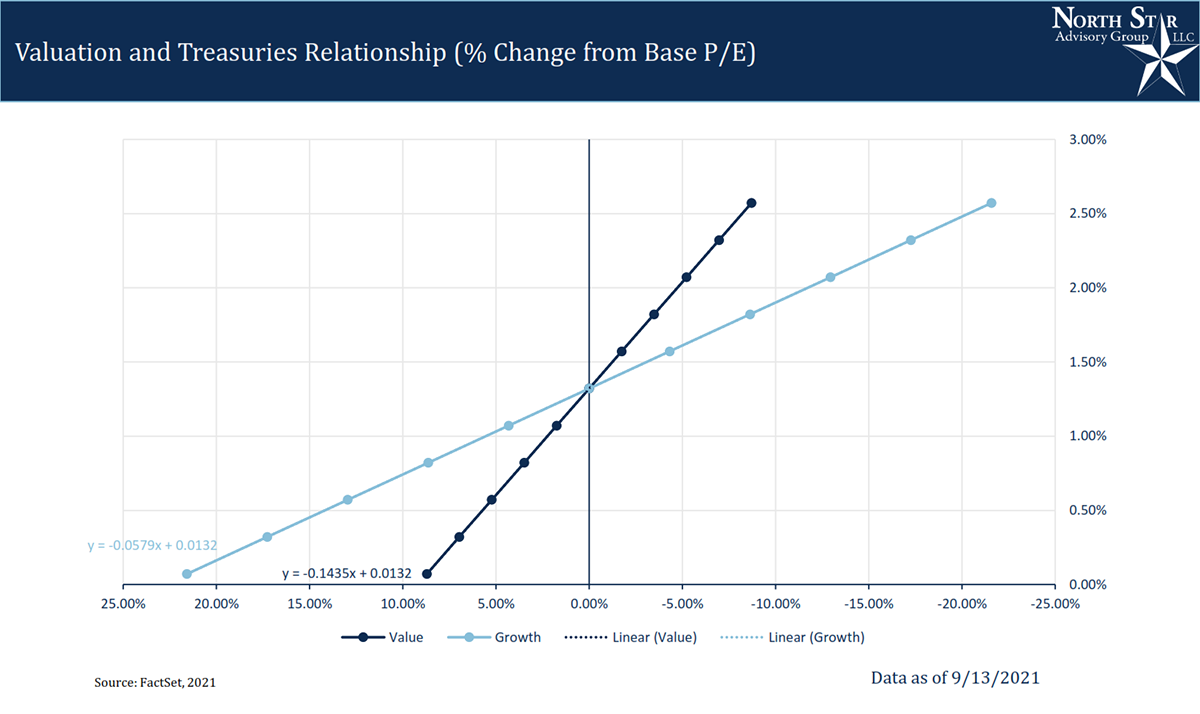
In the bottom two scatterplots, we've examined the relationship between stock valuations, via Price/Earnings (P/E) ratios vs. Treasury yields using regression analysis. This analysis illustrates equity valuation's sensitivity to treasury yields. As rates rise, according to financial theory, valuations compress. This same thought is proven in our analysis of 10 years of historical data. Isolating the impact of yields on valuation highlights the point that Growth and Value stocks do not exhibit identical moves when rates rise or fall. The bulk of a growth company's cash flows are expected later in their lives. Therefore, they are discounted more harshly by interest rates compared to the current cash flow present in value stocks. This discounting helped growth stocks over the last few years as the 10-year Treasury made a nosedive to a historic low of 0.5% and will act as a headwind to valuations as interest rates climb.
Value's relationship is vertical, showing less sensitivity to rising rates, and vice versa. It's important to realize that this analysis alone is not an exact forecast for where valuations will go given a certain move in rates. Valuations are also impacted by the number of shares outstanding, earnings and other factors. It does, however, provide insight to the headwind that rising rates will play on stocks. The faster the rates climb, the stronger the wind will blow on growth stocks.
Rising rates impact on growth & value stocks
Building on the last sections, it would be natural to ask “if rising rates are putting pressure on the P/E multiple for stocks in 2021, why do stock prices continue to climb?”
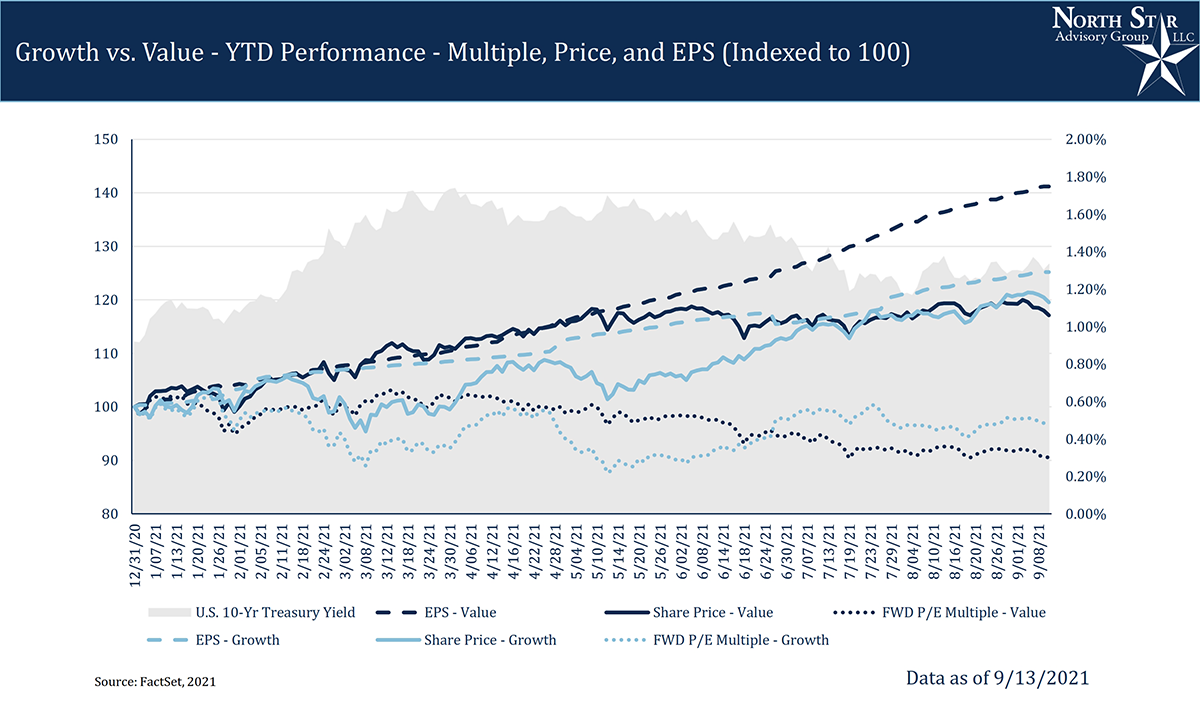
As treasury rates have had a volatile year, it is important to breakdown their effects on asset prices. Throughout 2021, we've seen corporate earnings grow at a high rate as the pandemic slowed in Q1 and early Q2. As the Delta variant emerged and spread rapidly, we've seen interest rates follow an inverse trend with Covid cases. This has caused volatility between growth and value equity. Overall year to date, rates have risen, and we've seen compression in the S&P 500's valuation multiples which are still well above averages. So where do we stand today? With the help of falling interest rates this summer, growth stocks have rallied to climbed to similar levels as value stocks. Meanwhile, value stocks are favored relative to growth stocks with:
- Higher forward earnings per share
- Lower current P/E levels
- Less headwind if/when interest rates start to climb
 Up until late 2016, there were few time periods that saw growth outperforming value (1999, 2007). Since 2016, we've seen a "hockey stick" pattern in large cap stocks, as large growth has dominated. History has taught us that violent movements in either direction is typically unstable and will correct through reversion. In the small and mid-cap areas of the market, the major winners have graduated from small/mid and continued to feed into large growth's continued outperformance. Recently, larger tech names had either acquired or crushed competitors, taking away steam from small and mid-growth. The results of these actions have focused the attention of antitrust regulators.
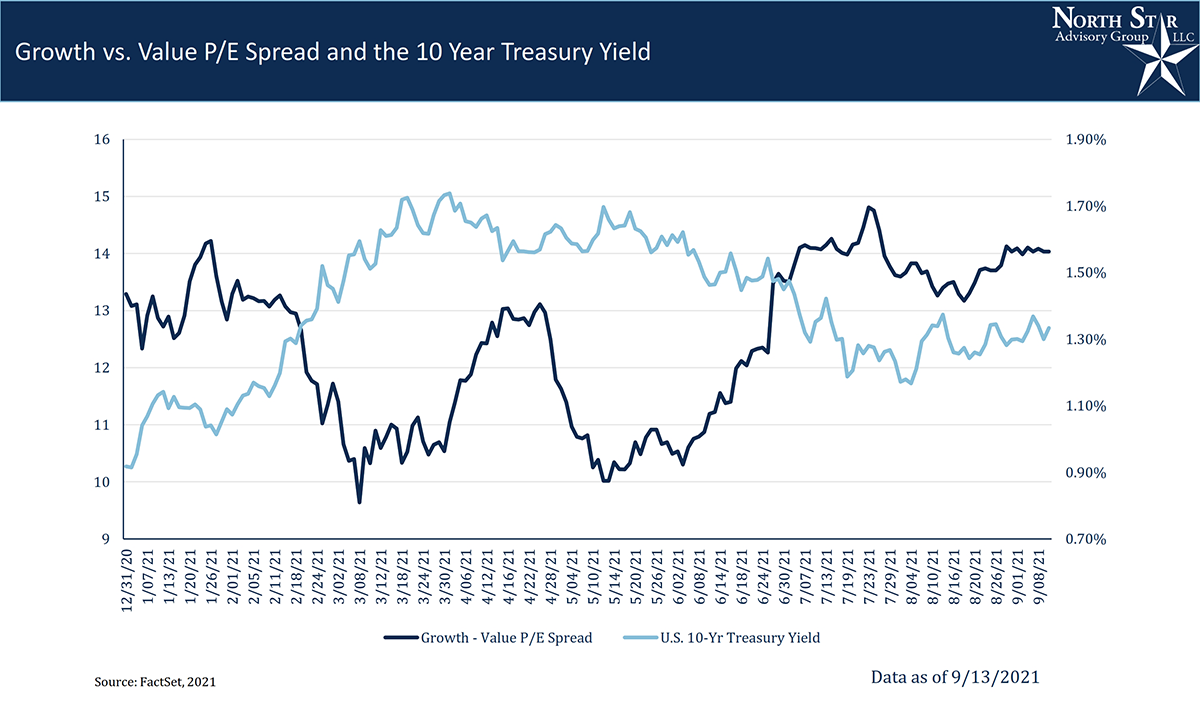
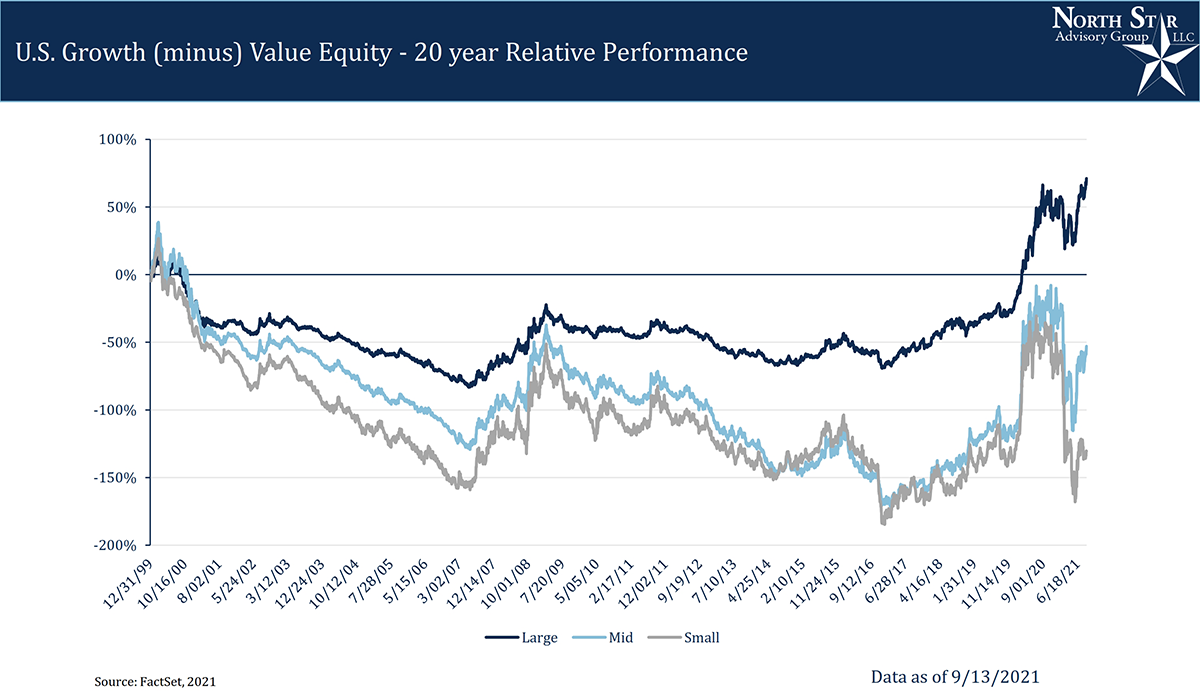 As we’ve discussed throughout the “Growth vs. Value” topic, we expand on interest rates impacting the different equity styles. In dark blue, we have the spread between growth and value forward P/E (Growth minus Value), with the 10 Year Treasury yield in light blue. From January to late March, we see the spread between growth and value compress, accompanied by rising rates. As rates went flat, growth attempted to widen the spread towards January highs, but was eventually compressed once again. Until early June, rates began their move backdown and the spread has once again widened. You can see this real impact in names like Apple, Microsoft, and other “FAANG” stocks continuing to outperform. In general, we’ve observed an inverse correlation between rates and growth outperformance. Rising rates do not mean that we shouldn’t hold growth stocks. There is a place for both in a portfolio, however they are influenced differently by rising and falling interest.
Supply, demand & container ship backlog
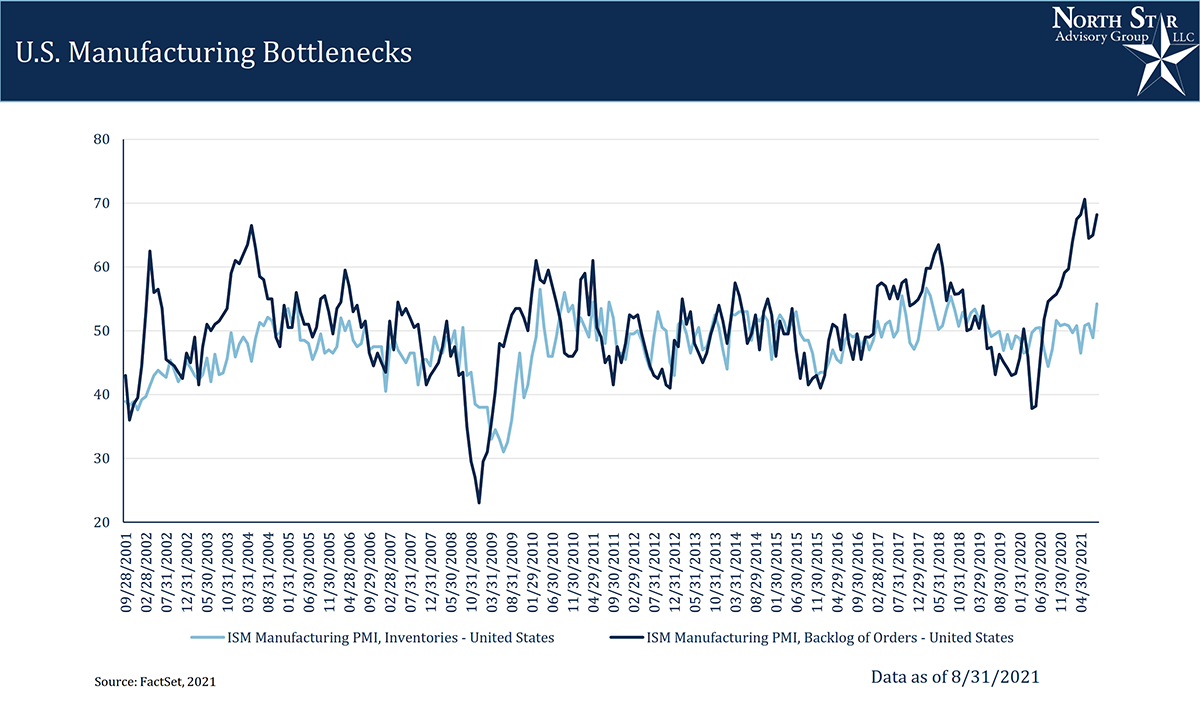
Weak economies and recessions are driven by low demand for goods and services. Pre-Covid, we wrote about our concerns of falling inventory levels as shown below in the light blue. What few have expected is the strong spike in demand, starting in mid-2021. Sparked by stimulus money, consumers continued and increased their demand causing a 20-year record high backlog for goods and services. The large backlog will help to stretch out the recovery from one crazy roaring 2020s summer into a multi-year expansion. Many companies are expecting that it will take them well into Q2-2022 just to fulfill their backlog and resume their “normal” levels of high demand.
If companies are scrambling to produce goods to fulfill these orders, where are they? Raw material shortages and factory shutdowns overseas are holding up some of the production. However, many of the goods have been produced, they are either waiting on container ships or waiting their turn for transit. The shipping logistics has not only increased the costs, but limited the ability for companies to know when their goods can be transported. A few large corporations have even moved to secure their own container ships!
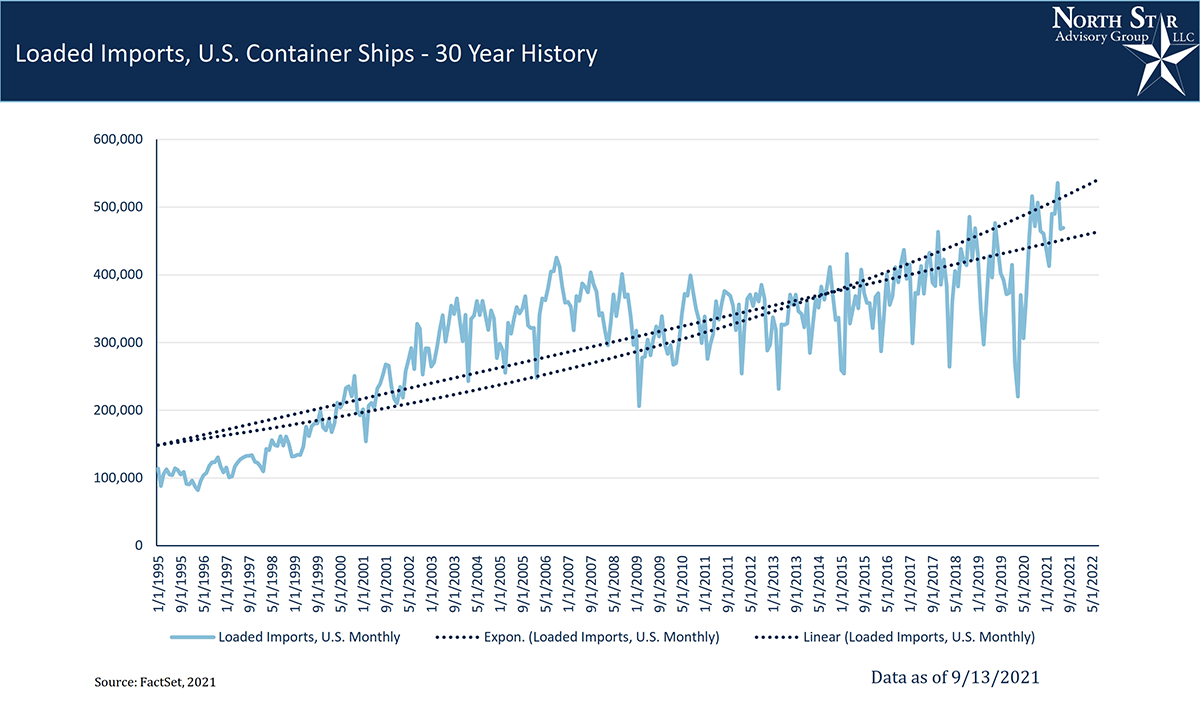
From a historical perspective, the amount of container ships with loaded imports has been extremely volatile on a month-to-month basis. Whether it is a 30-year, 10-year, or 5-year horizon, volatility is still a theme in this data. Due to the volatility, we see our 12-month forecasts are slightly lower than current loaded import levels. This implies that cargo ships are not at the focal point of the current supply chain issues. At ports, ships are anchoring at much higher rates than in the past, waiting for their turn to dock and unload. As ships continue to get bigger, there are fewer and fewer ports that can handle the mega ships. This could be due to issues at ports and distribution centers. Labor shortages are most likely the key to our current supply chain issue.
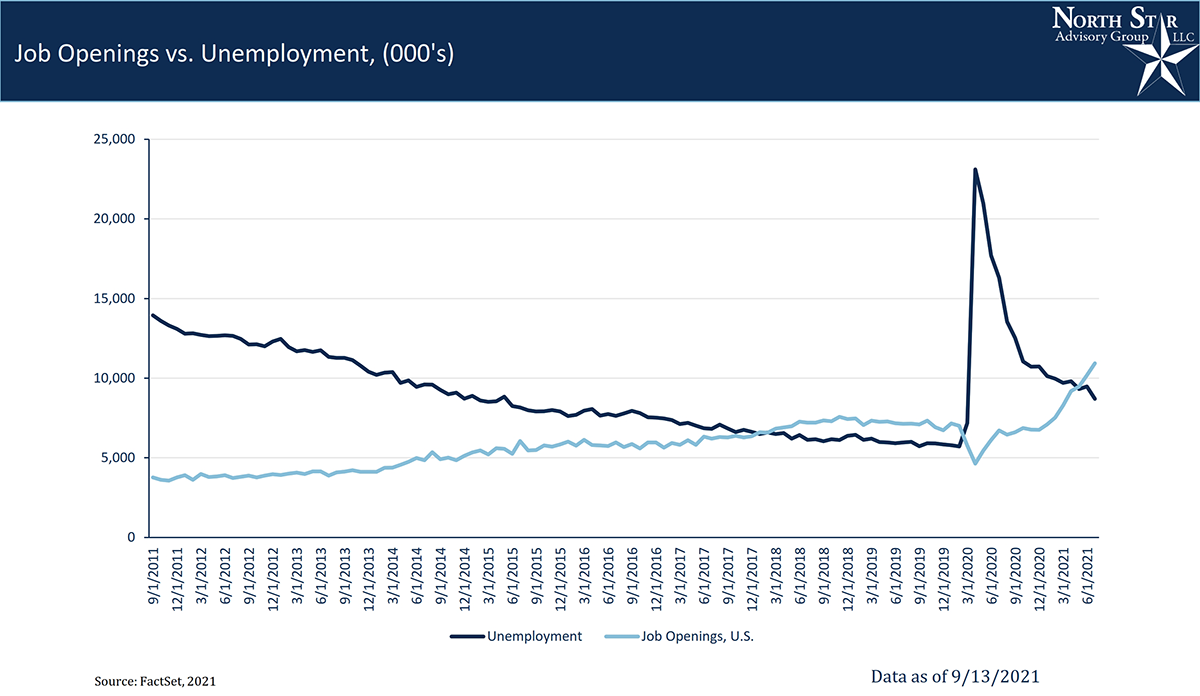
If we dig further into labor, we are likely finding the largest underlying issue. We have once again hit a point where there are more job openings versus unemployed (or those looking for employment). Covid has sent a shock through the labor force that will take years to sort out.
NSAG news
We have always been strong believers in raising our client’s investor IQ. Over the last 6 months, Brian and Mark have been working tirelessly to build out an extensive and proprietary market and economic educational reference tool that provides easy-to-follow, one-page visual summaries for our clients. The images shown in this month’s Timely Topics are just a sample of what NSAG plans on rolling out next month. While this data maybe too much for many to digest, we are working to increase the transparency and education that goes into our recommendations and planning.
Where will the equity markets go next?
As we showed above, the forward-looking earnings estimates continue to improve and the breadth of the recovery is wide. Both factors are supportive for the current level in the S&P 500 and additional modest growth into yearend. Analysts have underestimated the recovery from COVID and many investors have let their emotions sway their investment decisions. While the path forward will not be a straight line, we expect any pullbacks to be modest and focused on areas of bubbles and rising interest rates. The continued rotation from growth to value is likely to continue for at least the next year and should pick up steam as interest rates rise in connection with the Delta variant slowing down.
There continues to be virtually zero risk of a double-dip recession and the Federal Reserve is prepared to step in if necessary. We still believe we are in a secular bull market, which started in 2010 and typically lasts around 15-20 years. However, this secular market is likely to last longer.
We are passionately devoted to our clients' families and portfolios. Let us know if you know somebody who would benefit from discovering the North Star difference, or if you just need a few minutes to talk. As a small business, our staff appreciates your continued trust and support.
Please continue to send in your questions and see if yours gets featured in next month’s Timely Topics.
Best regards,


Mark Kangas, CFP®
CEO, Investment Advisor Representative