


Each month, we invite clients to spend a few minutes reading our newsletter to build their investor IQ. November’s edition of Timely Topics focuses on the importance of active management in the AI era.
Last month, we recorded a conversation between Frank Kelly, Head Geopolitical Advisor at DWS and North Star’s Mark Kangas and Brian Duffield. In this recording, we discussed various macroeconomic and geopolitical topics from Iran and Russia to demographic and longevity trends. Given that this was a departure from the typical Timely Topic’s format, we would appreciate any and all feedback from last month.
As we contemplate doing more recorded discussions for our clients, your input is invaluable. Please HERE to take a quick survey:
- Active vs. passive… what’s the difference?
- History of disruption
- The next wave
- 1954
- Social Security gets a raise in 2027
- Where will the stock market go next?
Active vs. Passive… what’s the difference?
In this month’s Timely Topics, we are exploring the role and importance of active management during the AI era. Before we dive in, we thought it would be important to start with the key distinctions between an actively managed strategy and a passively managed strategy.
Passive management is an investment approach designed to track a specific market index or benchmark rather than actively trying to outperform it. A passive portfolio typically buys and holds the securities that make up an index, such as the S&P 500, with relatively little trading or difference in weightings. The objective is to capture the overall return of a specific market or benchmark at a relatively low cost, rather than making individual investment decisions based on economic forecasts, company fundamentals, or market valuations. When investing passively, you are forced to own whatever is included in that passive fund’s benchmark. Because passive strategies generally involve less research, trading, and portfolio management, they tend to have lower fees and can be highly tax-efficient.
Active management takes a more hands-on approach, with a portfolio manager or investment team making deliberate investment decisions in an effort to outperform a benchmark or achieve a specific investment objective. Active managers analyze factors such as company fundamentals, valuations, economic conditions, interest rates, industry trends, and market sentiment to determine what to own, what to avoid, and how much to allocate to each investment. The goal is not simply to participate in market returns, but to identify opportunities where an investment's expected return may be greater than what the broader market is pricing in. This additional research and decision-making typically comes with higher costs and requires the manager to be correct often enough to justify those costs.
How have both styles of management performed historically? In the chart below, we’ve summarized the 10-year annualized return for various segments of the market, distinguished by style, size, and geography. The benchmark (dark blue bar) is the approximation for passive returns in each market, while the light blue bar represents the range between top and bottom performing active managers in each segment.
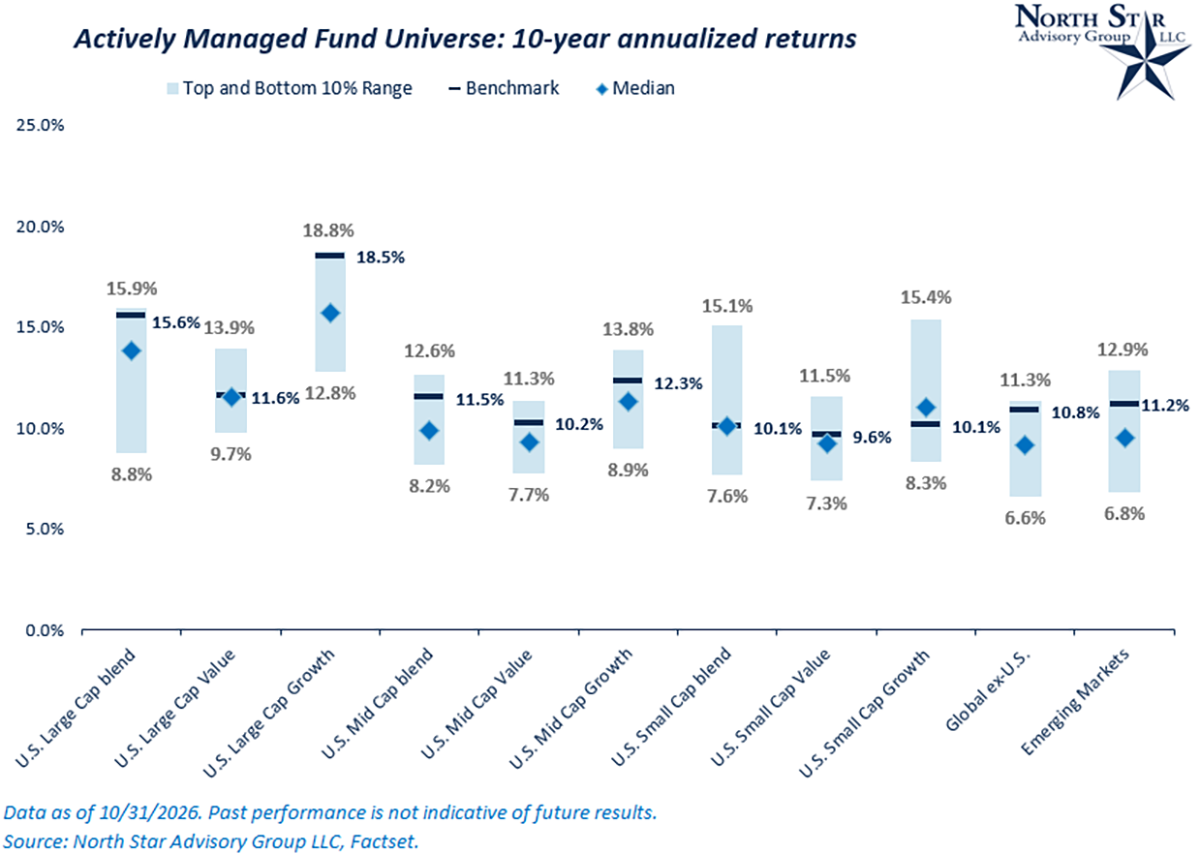
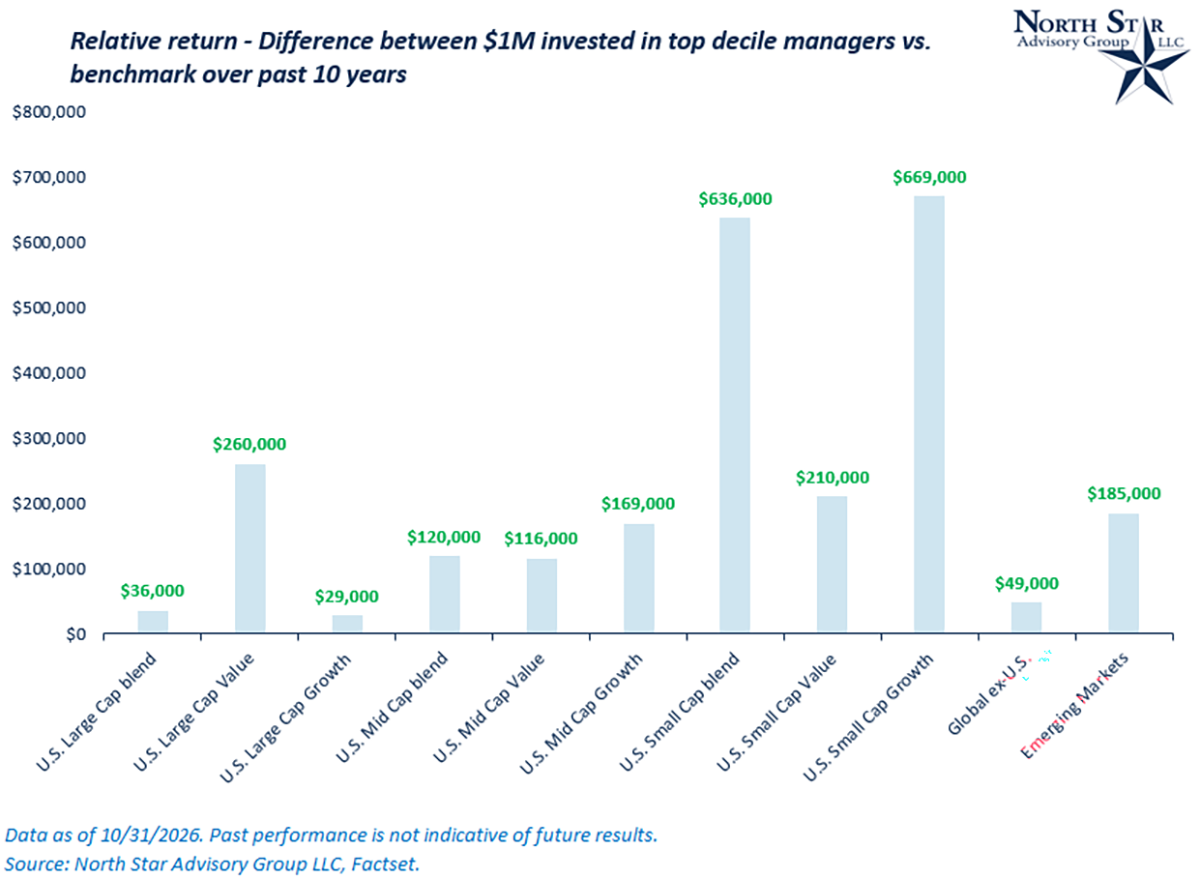
The key takeaway from this chart is that the top active managers (the average return for funds within the top decile), have shown outperformance relative to the passive benchmark in all market segments, albeit to various degrees. The slimmest margin between passive and top active managers has occurred in the U.S. large cap blend and growth segments. In both of these market segments, the big winners of the past 10 years have been the largest mega-cap names who have had many well-known acronyms in the past such as “FAANG” or “Mag 7”. Given how large these companies are, they have exerted their weight and influence on the overall return for these benchmark indices. These companies also saw the strongest earnings growth over the past 10 years, but in the AI era, this trend may not persist, and we’ve already started to see a reversal of this trend over the past 12-18 months.
Looking across the remaining segments, top active managers have shown very clear outperformance in large cap value, all small cap style spectrums, all mid cap style spectrums, and emerging markets. Small cap, mid cap, and emerging markets tend to have companies that have less coverage and are less followed by analysts and investors. Structurally, this factor allows strong fund managers to capitalize on market inefficiencies over time.
History of disruption
Artificial intelligence, like any revolutionary technology, is bound to create big winners and big losers. As active investors, we need to have a deep understanding of the technology itself, the industries/companies that may be in its crosshairs, and which companies will capture economic value as this technology progresses. We have to consistently ask ourselves, who are the disrupted and the disrupters? For passive investors who own very broad market exposure, they are likely owning both the disrupted and the disrupters.
For Timely Topic’s 4th of July edition (click HERE to read more), we wrote about historical periods of technological revolution, from railroads, to electricity, to the internet, and how those periods shared similar characteristics to today’s AI era. In this section, we are going one level deeper to understand how specific inventions and innovations have created and destroyed industries and companies over time.
In the table below, we’ve summarized a few company specific examples from history:

Even more broadly, the internet revolution itself is a great example of how new technologies shift can disrupt entire industries or sectors, not just companies.
The internet changed…
- How we shop: Brick and mortar -> e-commerce
- How we consume media: Physical tape or discs -> digital
- Travel agencies declined
- Newspapers declined
- Etc.
While we are always forward-looking as investors, we also need to have deep understanding of history in order to shape how we think about the future.
The next wave
History shows that transformative technologies rarely create value evenly across the economy. Railroads reshaped transportation and commerce, electricity changed industrial production, and the internet rewired how information, products and services reach consumers. Each revolution created new industries and extraordinary investment opportunities, but it also undermined established business models that once appeared durable. Artificial intelligence may prove similar, with one important distinction: AI has the potential to automate not only physical tasks but also portions of knowledge work itself. The investment implications extend well beyond the companies building chips, data centers and AI models. The more consequential question may be which existing businesses can use AI to expand productivity and strengthen their competitive positions, and which may see their pricing power, customer relationships or economic moats erode. For the first time in history, intelligence is becoming commoditized.
While there are various industries who are in AI’s crosshairs, it’s unlikely that an entire industries will vanish. Rather, industries will likely bifurcate:
- Software
- Outsourced customer service and business-process services
- Basic content creation, translation, and research
- Traditional data aggregation
- Certain recruiting, consulting, and professional-service tasks.
Using software as an example, it’s highly unlikely that the entire group will be disrupted and there will be winners and losers within this one group. Companies who have valuable proprietary data and infrastructure will likely see their businesses thrive due to agentic AI and consumption-based models (we wrote about this in March, click HERE to read more).
Content creators who differentiate themselves should continue to thrive. One of the most critically acclaimed movie directors, Christopher Nolan, still uses no CGI in 2026, and he had the highest grossing film this year (The Odyssey).
Companies who adapt and have a differentiator will likely thrive with AI while their peers may suffer, despite being in the same group or industry.
As the software industry diverges, we already have our first clear victim of AI. In the comparison below, we’ll compare that company (Company A) to a business who we believe is accelerating due to AI (Company B).
- Company A provides online educational resources and homework help, a business model pressured by free AI tools that can deliver similar answers and explanations.
- Company B provides enterprise workflow automation software, using AI to automate complex business processes and reinforce its deeply integrated enterprise workflows and systems.
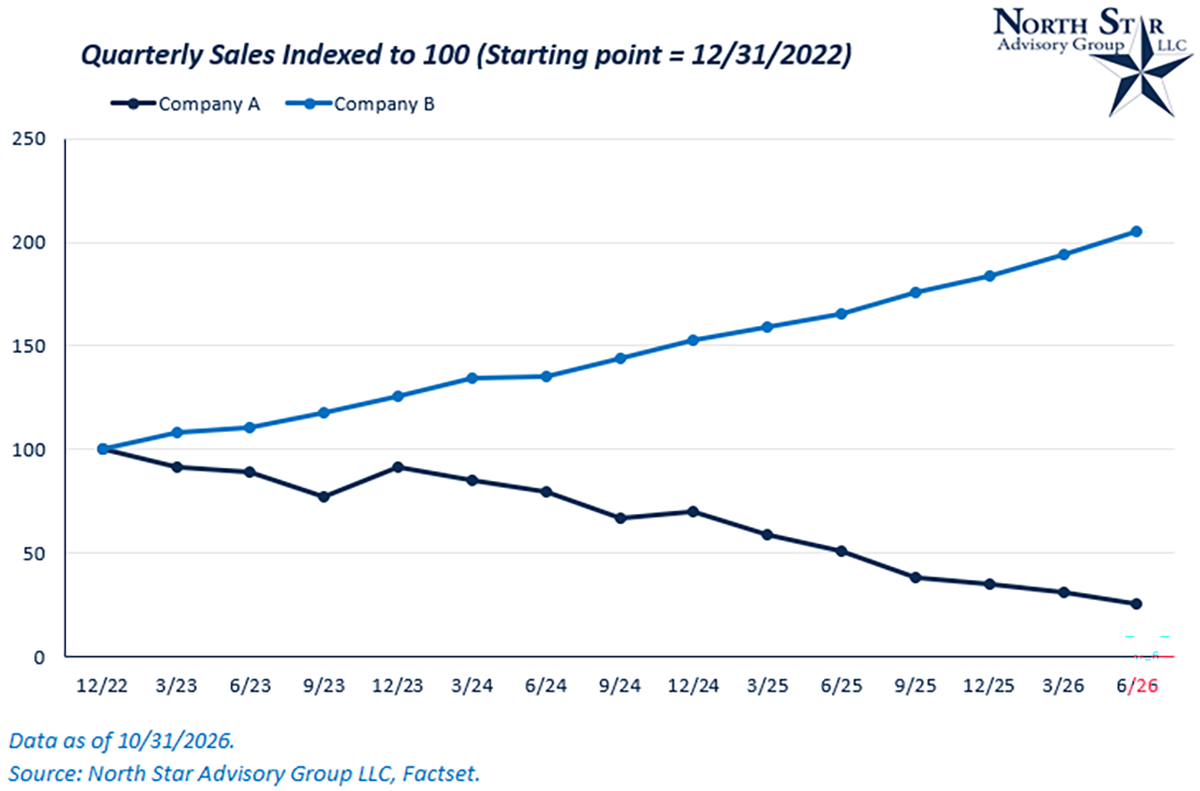
Company A’s stock is down ~97% and revenues are down ~75% since the release of ChatGPT in Q4 2022, while company B’s stock is up by ~103% and revenue has grown by ~106%. As AI adoption accelerates over the years, we expect to see more of these divergences across many industries.
Do you know companies A and B? Send us your guesses.
1954
As we examine past technological advances, consider AI’s future impact, and discuss active management during technological change, it’s worth remembering that the broader stock market looks ahead. Short-term shifts in sentiment should not guide our long-term investment decisions; thorough due diligence and sound reasoning should.
We recently saw a quote from Warren Buffet that we thought encapsulated the market’s forward-looking nature and the difficulty associated with trying to make short-term directional predictions on markets based on current economic conditions.
"What do you think the best year for the market has been since 1942?... The answer is 1954. And in 1954, the Dow counting dividends was up 50%. Now if you look at 1954, we were in a recession a good bit of that time... Unemployment peaked in September of 1954... It's a terrible mistake to look at the economy and think that's the market." – Warren Buffet speaking at Columbia University on 11/12/2009.
Instead of focusing solely on 1954 and Buffet’s quote, we ranked the annual return for the S&P 500 for each year since 1945 and compared those returns to the unemployment rate, ranked by year. To no surprise, the correlation between the two data sets was -16%, or in other words, market returns and employment are unrelated when you zoom out and look at the data in this way. In 1958, the unemployment rate had risen to 6.9%, an increase of 2.6 points from the prior year’s reading of 4.3%. 1958 was the second-best year since WWII for market returns as the S&P 500 gained ~38%.
This example does not diminish the economy’s role as the long-term driver of stock market returns. Rather, it shifts the focus to understanding what information is already reflected in market prices and what future developments the market may be underestimating.
Social Security gets a raise in 2027
For millions of retirees, January will bring a slightly larger Social Security check. The Social Security Administration recently announced a 3.6% cost-of-living adjustment (COLA) for 2027, increasing benefits to help offset the effects of inflation. For someone receiving a $2,000 monthly Social Security benefit, a 3.6% adjustment would translate to about $72 more per month, or roughly $864 over the course of a year. While that may not dramatically alter anyone's retirement lifestyle, it can help offset rising costs and preserve purchasing power over time.
So, is 3.6% a big deal? Well… it's all relative.
A few years ago, inflation surged to levels not seen in decades. The economy was emerging from the pandemic, supply chains were strained, labor shortages pushed wages higher, and consumers faced rapidly rising prices for everything from groceries and gasoline to housing and healthcare. Because Social Security COLAs are designed to help benefits keep pace with inflation, retirees received unusually large increases, including the 8.7% adjustment in 2023.
Fortunately, there is another way to interpret today's smaller COLA: the worst of the post-pandemic inflation surge appears to be behind us. Prices are still rising, but at a slower pace than they were during the peak inflation years of 2021 and 2022. As a result, the 2027 adjustment of 3.6% reflects a more stable economic environment than retirees faced just a few years ago. While it may not generate the attention of the record-setting increases seen during the inflation spike, that's not necessarily bad news. That said, inflation remains a part of everyday life. Recent inflation readings suggest that progress has become less straightforward, with price growth stabilizing and, in some categories, reaccelerating modestly compared to the past two years. Energy costs, in particular, can have an outsized impact on inflation because changes in oil, gasoline, and utility prices affect household budgets directly while also increasing transportation and production costs throughout the broader economy.
Readers comparing this year's COLA to recent inflation data may notice that the figures do not always match exactly. That's because Social Security's COLA is not based on year-end inflation readings. Instead, it is calculated using the Consumer Price Index for Urban Wage Earners and Clerical Workers (CPI-W) and relies on a comparison of average inflation readings during the third quarter of the year. As a result, the COLA reflects inflation that has already occurred, while the more familiar annual Consumer Price Index (CPI) figures often capture changes through the end of the calendar year. Because the measures cover different populations and different time periods, they tend to move in the same direction over time but rarely align perfectly in any given year. Looking at the accompanying chart, you'll notice that both inflation and Social Security adjustments surged during the post-pandemic period and have since moderated, even if the exact percentages differ from year to year.
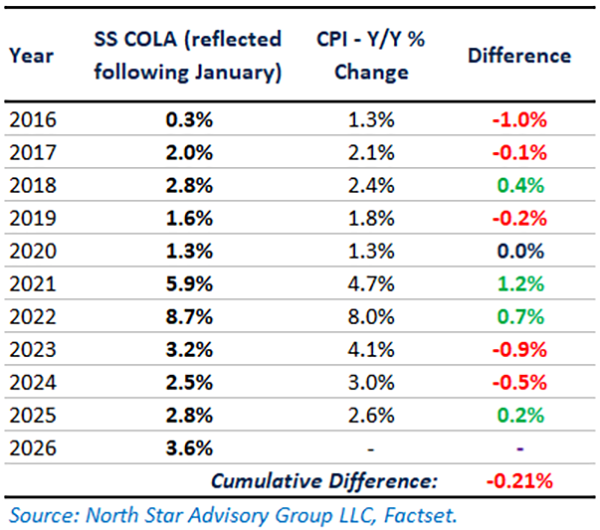
Social Security recipients have experienced a wide range of COLA adjustments over the years. Since automatic annual COLAs were introduced in the mid-1970s, adjustments have ranged from 0% in years of very low inflation to more than 14% during periods of significant price increases. Viewed through that lens, the 2027 COLA sits comfortably in the middle of the historical range: meaningful enough to provide additional income, yet also reflective of a more stable inflation environment than retirees faced just a few years ago.
While a COLA increase boosts Social Security income, a portion of that increase is often absorbed by rising healthcare costs, including Medicare premiums, prescription drug expenses, and other medical costs. In other words, a COLA may help maintain purchasing power, but it doesn't always feel like a true raise. That's one reason the recent $90 Medicare rebate checks attracted so much attention.
The $90 Medicare rebate checks were separate from Social Security and were funded through the Medicare Improvement Fund (MIF) using money that had already been earmarked for Medicare-related purposes. Historically, the MIF was established as a reserve fund intended to support improvements and enhancements to the Medicare program itself. Over the years, Congress has redirected, modified, and repurposed portions of the fund through various legislation. The recent rebate program represents a somewhat different use of those existing funds because the dollars were distributed directly to eligible beneficiaries rather than being used exclusively for programmatic improvements. As a result, the rebate was not a permanent increase in Medicare or Social Security benefits, but rather a one-time distribution from an existing pool of government funds.
Perhaps that's the best way to think about a COLA. Its real value isn't found in the size of the increase, but in its ability to help retirees maintain the purchasing power of their benefits over time. While larger adjustments often make headlines, the goal of the program isn't to make retirees wealthier. It's to help ensure that a fixed income retains its purchasing power as the cost-of-living changes over time.
Where will the stock market go next?
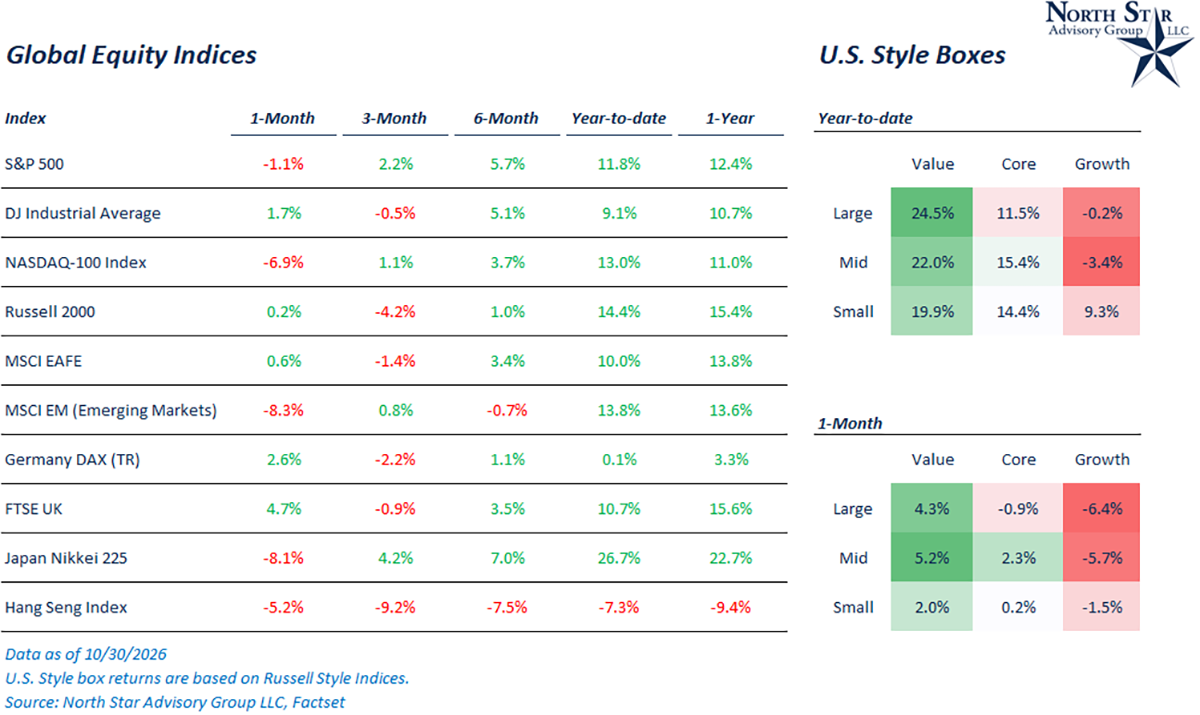
In October, the S&P 500 fell by ~1%, and as of 10/31/2026, is off its high point for the year by ~4%. While this level of decline at the index level is more than normal, there has been more carnage underneath the hood, particularly with smaller AI-related companies and highly leveraged businesses in the face of an elevated rate environment. At the beginning of the month, ~76% of S&P 500 constituents were trading below their 50-day moving averages, a 1.60 standard deviation move when measured weekly. Historically, this has been a counter signal for the broader market. Over the past 26 years, the 75% threshold has been breached 139 times when measured weekly, and the subsequent 1-year return for the S&P 500 Equal Weight Index has a median value of 22% with an ~83% positive return rate. We expect stronger breadth throughout the rest of 2026, barring any shocks in the market.
The Nasdaq 100 Index felt the most pain during the month, down ~7%, and the technology index is off its high by ~9%, putting the sector into correction territory, and in line with the March sell off at the beginning or the Iran conflict.
Zooming out, U.S. markets as measured by the S&P 500 are still positive on the year by 11.8%. While stocks are up, earnings and profit expectations are up even more. Estimates for 2026 earnings per share have outgrown the index, up by 17% since the start of the year. Of course, these are just estimates. What about actual earnings over the past twelve months? They’ve grown 29%. So, valuation multiples contracted throughout the year, and this is simply a function of investors pricing in some uncertainty around AI-related earnings growth expectations. As many news outlets and headlines push a the “bubble” narrative, contracting valuations tell another story as that is not a normal dynamic seen when in a bubble.
Treasury rates have eased in the second half of October as the U.S. 10-Year Treasury rate is back under 5%. In the very near term, daily rate moves have become increasingly tied to technology stocks as financing has emerged as the new and maybe largest bottleneck within the AI trade.
Over the coming weeks and months, we will closely be watching for any negative earnings revisions to judge how accurate the valuation compression will prove to be. We expect to see continued choppiness in stocks who are most closely related to AI infrastructure spending. There is a very strong demand profile, but bottlenecks continue to pop-up which will make the ride anything but a straight line.
We are passionately devoted to our clients' families and portfolios. Contact us if you know somebody who would benefit from discovering the North Star difference, or if you just need a few minutes to talk. As a small business, our staff appreciates your continued trust and support.
Keep sending your questions for a chance to be featured in next month’s Timely Topics.
Best regards,


Mark Kangas, CFP®
CEO, Investment Advisor Representative


Brian Duffield, CFA®
Co-Portfolio Manager & Market Strategist