


Each month, we invite clients to spend a few minutes reading our newsletter to build their investor IQ. September’s edition of Timely Topics focuses on how interest rate levels have driven stock and bond portfolios historically, a “Trump” accounts crash course, and NSAG news.
- Higher for longer
- Rate changes
- Fiscal Stress
- Trump Accounts: what parents need to know
- NSAG News
- Where will the stock market go next?
Higher for longer
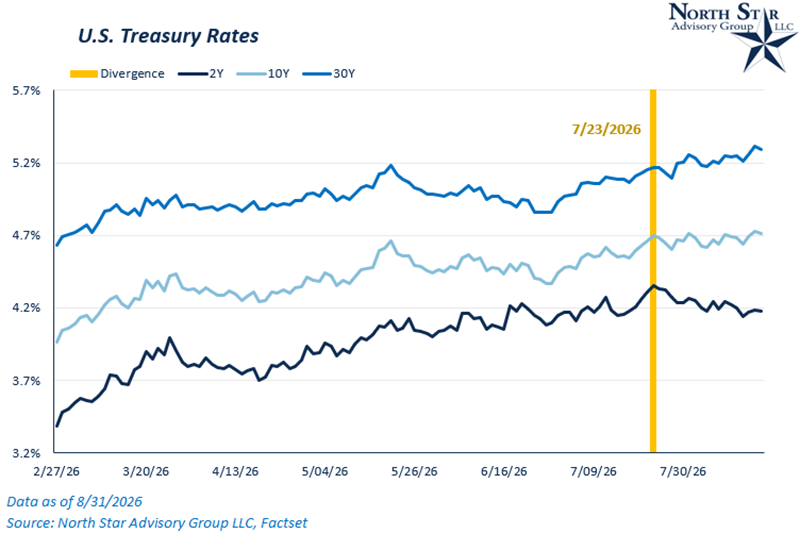
As the war with Iran continues, oil prices and interest rates remain elevated. While oil prices have pulled back meaningfully from their highs for the year, interest rates have continued to move higher. The U.S. 10-year Treasury yield reached 4.75% at the end of August, while the 30-year yield finished the month at 5.25%. Investors understandably remain focused on the potential economic consequences of the war, including higher oil prices and renewed inflationary pressures. However, these factors represent only part of the story behind the recent rise in Treasury yields.
Looking at the yield curve since the war began, short- and long-term rates initially moved largely in tandem. That relationship has started to change, however, with the 2-year yield declining since late July while the 10- and 30-year yields have continued to rise. This divergence suggests that investors are increasingly focused on longer-term fiscal concerns, including elevated government spending and the growing national debt. Increased Treasury issuance is also putting additional pressure on the long end of the curve, while increased corporate bond issuance related to AI infrastructure investment and the strength of the equity market may be further limiting demand for longer-duration government bonds. Although this divergence has emerged only gradually over the past few weeks, it shows that different points on the yield curve are responding to different forces, with longer-term rates increasingly shaped by more structural factors.
With long-term interest rates reaching their highest levels since 2007, comparisons between today's market and the period leading up to the Global Financial Crisis have become increasingly common. While higher rates have understandably caused some investors to question the outlook for equities, we wanted to take a step back and examine the historical relationship between interest rate levels and subsequent returns for both stocks and core bonds. In doing so, we can better understand what today's elevated rates may actually mean for investors.
Two clear takeways:
- Current interest rate levels heavily influence future return outcomes for bonds in the long run.
- Current interest rate levels alone do not indicate any clear trajectory for stocks broadly in the long run.
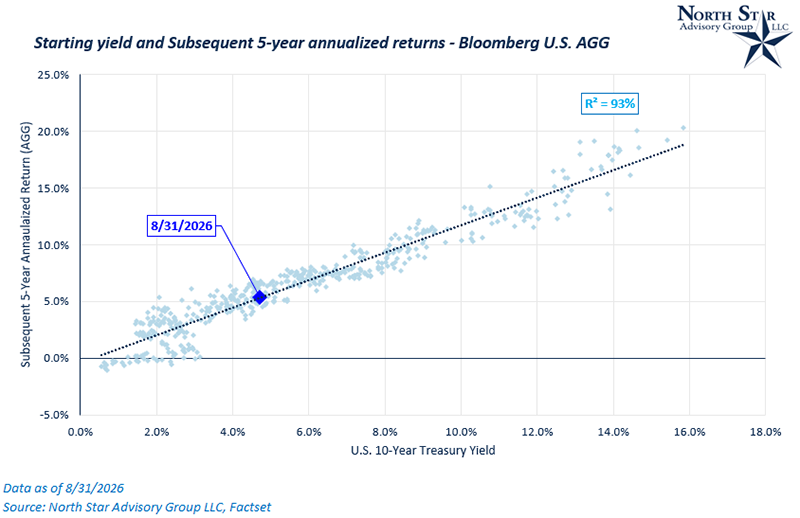
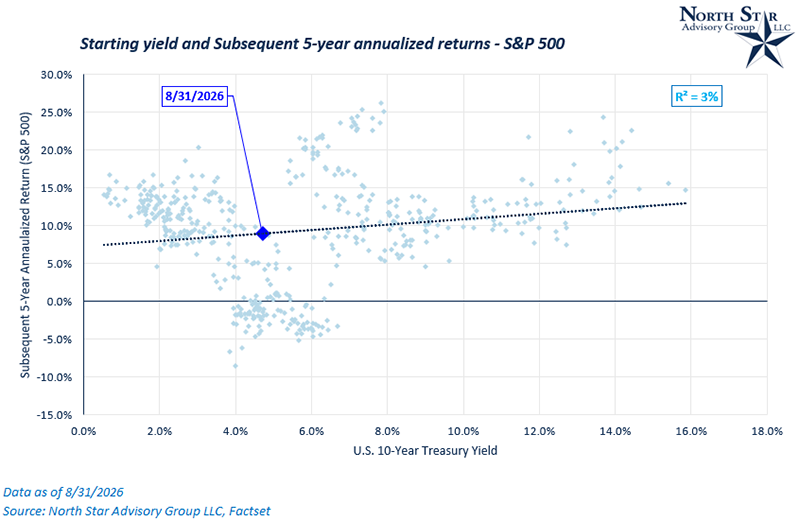
At a simplistic level, the value of a stock, like any asset, is the present value of the future cash flows it is expected to generate. Higher interest rates can reduce that present value by increasing the rate used to discount those future cash flows. However, interest rates are only one part of the equation. The future cash flows themselves are driven by factors such as economic growth, industry trends, competitive dynamics, and company-specific fundamentals, which can ultimately have a much greater influence on stock prices.
Rate changes
Rather than simply analyzing the absolute level of interest rates, we took the analysis in the first section one step further: Do changes in rates consistently effect stock returns in the long run? The data strengthens our claims in the the first section. We measured five-year changes in the 10-year Treasury yield against five-year returns for both stocks and core bonds. The results reveal a stark difference between the two asset classes: the S&P 500 had virtually no correlation with changes in long-term interest rates, while core bond returns had an 80% correlation with changes in rates. In other words, changes in interest rates have historically been a much more reliable indicator of bond performance than stock performance. This reinforces the idea that while interest rates are an important input into equity valuations, the direction of rates alone tells us surprisingly little about where stocks will ultimately perform.
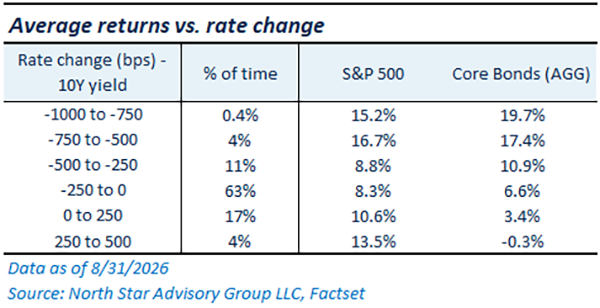
While the historical data suggests that changes in interest rates have limited predictive power for broad stock returns, statistics alone do not explain why that relationship exists. To better understand the dynamics at play, it is helpful to examine periods when rates rose significantly and look at what was happening beneath the surface of the economy and equity market. In some cases, rising rates reflected stronger economic growth and improving corporate earnings. In others, they reflected inflationary pressures and tighter financial conditions. These real-world examples help illustrate why similar moves in interest rates can produce very different outcomes for stocks.
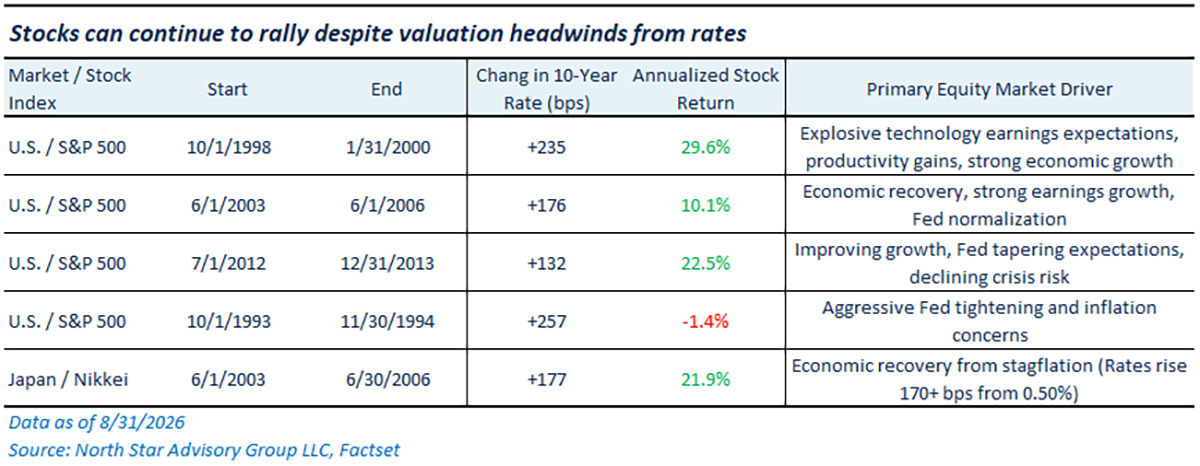
The table above highlights several periods when interest rates rose sharply while stocks continued to climb. For example, the strong stock returns from 1998 to 2000 were driven largely by rising earnings expectations for technology companies and robust economic growth, rather than being derailed by the roughly 200-basis-point increase in Treasury yields. The bottom line is that interest rates are an important factor to consider when investing in any asset class, but the weight investors should place on rates depends heavily on the asset class in question. For bonds, changes in rates have historically been a powerful driver of returns. For stocks, however, the impact of rising or falling rates depends much more on why rates are moving and how those changes affect economic growth, corporate earnings, and investor expectations.
Fiscal Stress
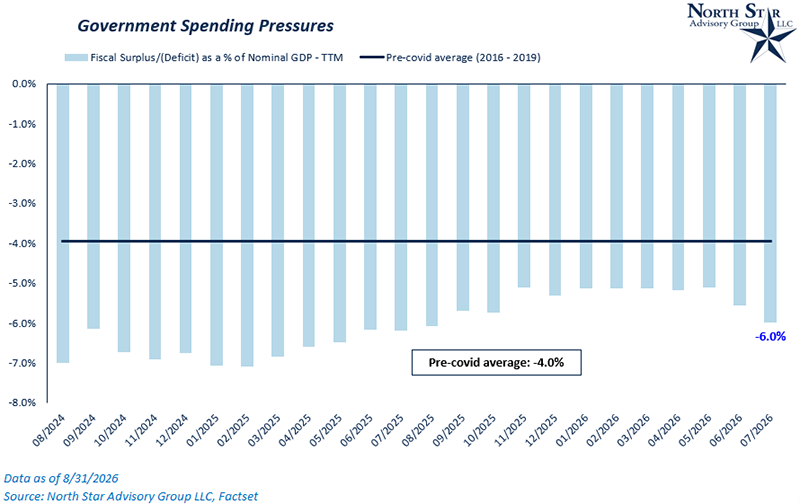
Because we believe fiscal pressures and muted demand for longer-duration Treasuries are playing an increasingly important role in the rise in long-term interest rates, it is important to support that view with both quantitative and qualitative evidence.
On August 19, 2026, the U.S. Treasury Department announced that it would at least double the size of its Treasury buyback operations, increasing purchases from $2 billion to $4 billion per operation across 10-, 20-, and 30-year maturities between September 9 and November 4. While the announcement initially provided some support to the Treasury market, that reaction quickly faded, with long-term yields rising over the following week. In our view, the increased buybacks represent a near-term effort to provide additional support to the long end of the Treasury market rather than a solution to the underlying issue. The more fundamental concern remains the balance between the growing supply of Treasury securities and the willingness of investors to absorb that supply at current interest rates.
The chart below highlights the broader fiscal backdrop. The federal deficit remains elevated relative to the size of the economy, while government spending as a share of nominal GDP continues to run above pre-COVID levels. This persistent fiscal imbalance is increasingly relevant for long-term Treasury yields, as investors demand greater compensation to hold longer-duration government debt amid concerns surrounding the trajectory of government debt and future Treasury issuance.
We’ve written about this topic a couple of times over the past year:
May 2025 – Yield Pressures
June 2025 – Failed big, beautiful treasury auction
If this environment persists and long-term rates continue rising faster than short-term rates, we continue to believe investors should consider emphasizing shorter-duration, high-quality bonds within their fixed-income portfolios. For stocks, however, we would not view this dynamic as a primary driver of investment decisions, as discussed in the previous two sections. While higher long-term rates can put pressure on equity valuations, companies with strong balance sheets, lower leverage, durable cash flows, and less sensitivity to financing costs may be relatively better positioned in an incrementally higher rate environment.
Trump Accounts: what parents need to know
Trump Accounts are a new tax-advantaged savings vehicle for children, created under the 2025 reconciliation law. They function as a special type of IRA for minors, with their own rules for eligibility, contributions, and withdrawals.
Who's eligible?
Any child under 18 with a valid Social Security number can have an account opened on their behalf. There's no income restriction on the family.
A separate, one-time $1,000 federal seed contribution from the U.S. Treasury is narrower It's only for children who are U.S. citizens, have an SSN, and were born between January 1, 2025, and December 31, 2028. Children born earlier can still have an account, just not the federal deposit.
Contribution rules
Contributions can begin on July 4, 2026, and the rules are more specific than a flat number
- $5,000 per child, per year is the combined cap on private contributions in 2026, adjusted for inflation after 2027. This is shared across all contributors including parents, grandparents, friends, and the child's own contributions. Not a separate $5,000 for each person. If a parent gives $4,000 and a grandparent adds $2,000, the account is $1,000 over the limit.
- Employers can contribute up to $2,500/year per employee (covering all of that employee's children combined, not $2,500 each), and this counts toward the $5,000 cap, not on top of it. These contributions aren't included in the employee's taxable income. While employers can generally treat these contributions as a deductible business expense, they need to have a formal written benefit plan to make the contributions.
- The $1,000 federal seed deposit does not count against the $5,000 cap, nor do contributions from nonprofits or government sources.
- Since no income limits apply, a household earning $40,000 and one earning $4 million face the same $5,000 ceiling.
- No tax deduction for contributions. Money goes in after-tax, similar to a Roth IRA, with tax-deferred growth until withdrawal.
- Excess contributions are penalized: amounts over $5,000 must be removed or trigger the standard 6% excess-contribution excise tax, mirroring regular IRA rules. There's no April 15 grace period as the deadline for a given year's contributions is December 31.
- Funds must be invested in mutual funds or ETFs tracking the S&P 500 or a similar broad U.S. equity index. With a more restrictive list, families don't get to pick individual stocks.
How to open an account
An authorized adult elects to open an account via IRS Form 4547, or online through the individual's IRS account.
Withdrawals
Funds generally can't be withdrawn before January 1 of the year the child turns 18. After that, the account converts to a traditional IRA and follows standard IRA withdrawal rules. Withdrawals are taxed as ordinary income, although the after-tax contribution portion is exempt. The tax treatment of earnings as ordinary income vs capital gains rates is typically why NSAG encourages clients to utilize other investment account options.
vs. a 529 plan
A Trump Account isn't a substitute for a 529. A 529 stays focused on education costs and provides tax free growth for education costs with the ability to be passed to other family members and converted to Roth IRAs. A Trump Account is a broader, general-purpose long-term investment account.
vs. a minor Roth IRA
While a minor Roth IRA offers much more favorable tax benefits relative to a Trump account, they still require documented earned income for the child in order to contribute, whereas Trump accounts don’t require it. If you’re saving for a working teen, minor Roth IRAs likely make more sense.
Bottom line
Trump Accounts add another long-term savings option, especially valuable for children who qualify for the $1,000 federal seed. But the $5,000 combined annual cap means families with multiple contributors need to coordinate to avoid penalties. As with any savings decision, it's worth weighing against 529s, Roth IRAs, custodial accounts, and other vehicles in light of the family's broader goals.
NSAG News
North Star Advisory Group is excited to congratulate Riley on accepting a full-time position with the firm following her graduation from Bowling Green State University in the spring of 2027.
Riley joined North Star as a summer intern in 2026, and she quickly became a valued member of our team. Throughout her internship, she demonstrated a strong work ethic, curiosity, and eagerness to learn, while making a meaningful contribution to our firm and our clients.
We are thrilled to have the opportunity to continue working with Riley and look forward to seeing all that she accomplishes as she begins her career with North Star Advisory Group. Congratulations, Riley!

Forrest brings home another championship in Canada
A huge congratulations to our own Forrest, who helped lead the Lithuanian Athletic Club Žaibas (Lithuanian for "Lightning") to another championship victory at the 2026 Wasaga Beach Baseball Tournament in Ontario, Canada.
The win marks an impressive third consecutive tournament title for Forrest and his teammates, who battled through a highly competitive field featuring elite teams from Detroit, Toronto, Mississauga, Hamilton, and across North America.
Hosted annually by ŠALFASS, the North American Lithuanian Physical Education and Sports Association, the tournament brings together athletes from Lithuanian communities throughout the United States and Canada. Wasaga Beach has long served as the event's home, thanks to its scenic sand dunes and pine forests that closely resemble Lithuania's Baltic coastline.
While we're proud of Forrest's accomplishments on the diamond, those who work alongside him at NSAG see many of the same qualities every day. The dedication, preparation, and teamwork that contribute to success in championship competition are the same traits Forrest brings to serving clients and collaborating with colleagues. Whether helping clients navigate important financial decisions or supporting fellow team members, he consistently demonstrates the commitment and work ethic that make both great teammates and trusted advisors.
Congratulations, Forrest, on the three-peat and another gold medal performance. We're proud to have a champion on the NSAG team!

Where will the stock market go next?
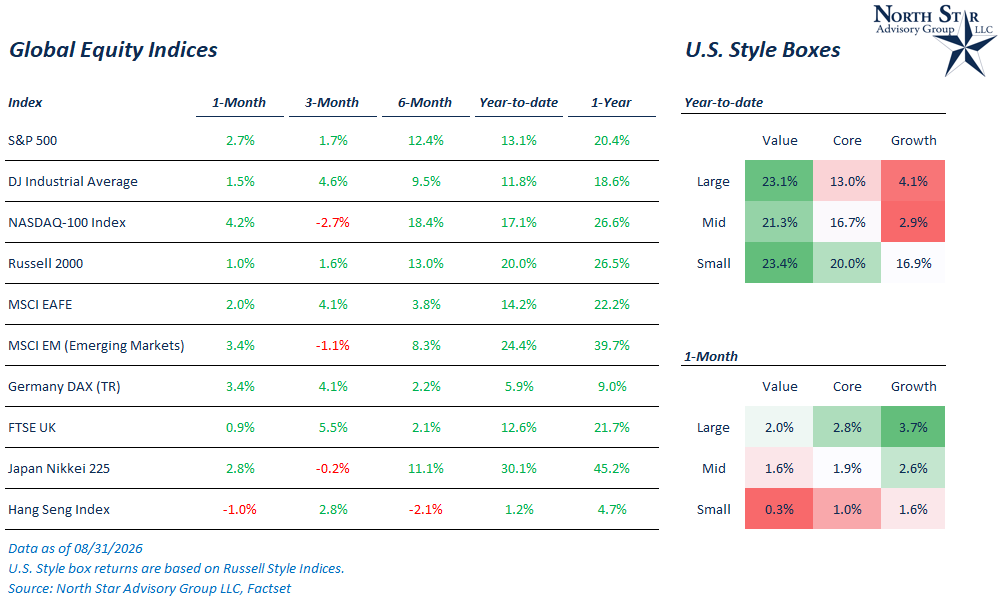
Volatility calmed in August following the semiconductor stock rout in June and July. Broadly, all major stock indices were positive for August, led slightly by technology stocks. While technology stocks led the market, with the Nasdaq 100 Index up by 4.2%, the sub-sector of software was the real driver, up ~15% for the month while semiconductor stocks were only up by ~2%. Volatility in semiconductor names calmed but prices haven’t yet shown solid signs of a recovery from the 23% drawdown experienced between June and July. Positive outlooks from many software and cybersecurity companies calmed some of the AI-disruption fears from earlier in the year, sparking the rally for the sub-sector. Elsewhere in the U.S., small cap stocks were positive for the month, up 1%, but felt some pressure from higher interest rates. Small caps are still well outpacing large caps on a year-to-date basis.
Looking abroad, the MSCI EAFE Index and the MSCI Emerging Markets index returned 2.4% and 3.6%, respectively in August. These non-U.S. markets continue to outperform U.S. markets on a year-to-date basis.
Over the past 10 years, September has tended to be the worst month for the S&P 500 with an average monthly return of -1.3%. While this seasonality is important to note, we also think that it is important to note that June and July have been the 2nd and 3rd best months over the past 10 years, and despite that, the index was negative in both of those months for 2026. We could see reverse seasonality trends continue.
There is a lot happening in the month of September, with another FOMC meeting and the planned visit to Washington by President Xi of China. Mid-term elections are getting closer, and we expect some continued efforts by the Trump administration to find any path towards a de-escalation in Iran as citizens continue to view the economy negatively, driven by higher energy prices. Next month Mark and Brian will be conducting a recorded panel discussion with Frank Kelly, a geopolitical advisor at DWS, and will be discussing the implications of all of these events and more.
We are passionately devoted to our clients' families and portfolios. Contact us if you know somebody who would benefit from discovering the North Star difference, or if you just need a few minutes to talk. As a small business, our staff appreciates your continued trust and support.
Keep sending your questions for a chance to be featured in next month’s Timely Topics.
Best regards,


Mark Kangas, CFP®
CEO, Investment Advisor Representative


Brian Duffield, CFA®
Co-Portfolio Manager & Market Strategist