


Each month we ask clients to spend a few minutes reading through our newsletter with the goal of raising their investor IQ. June's edition of Timely Topics examines the latest trends observed in various economic data series, highlighting the key distinctions between different types of data. We also discuss the recent downgrade of U.S. sovereign debt by Moody’s and an investment in gold.
- Consumer sentiment
- Failed big, beautiful treasury auction
- Moody’s plays catch up
- Gold Rush Update
- NSAG News
- Where will the stock market go next?
Consumer Sentiment
In May, the University of Michigan Consumer Sentiment Index posted a preliminary reading of 50.8, marking the second-lowest level in the survey's nearly 75-year history. While this sentiment survey provides insightful information on how households are feeling at a particular time, it has historically provided a countersignal for stock markets. But, before we break down the influences within this poor reading, it’s important to have context around the survey. Respondents were surveyed between April 22nd and May 13th. The U.S./China preliminary trade agreement was announced on May 13th, so this development was not reflected in the survey’s results.
Key takeaways from the survey include; continued tariff concerns, inflation concerns (tariffs), political polarization, and concerns over personal finances.
Tariffs and Trade Policy Uncertainty Approximately 75% of survey respondents spontaneously mentioned tariffs, up from 60% in April. President Trump's trade policies, particularly high tariffs on Chinese imports, have fueled concerns about rising prices and economic instability. Although a temporary reduction in tariffs was announced during the survey period, it had a minimal impact on overall sentiment.
Rising Inflation Expectations Short-term inflation expectations surged to 7.3%, the highest since 1981, while long-term expectations increased to 4.6%, the highest since 1991. These heightened expectations reflect fears that tariffs will lead to sustained price increases.
Concerns Over Personal Finances Assessments of personal financial situations declined by nearly 10% as consumers are increasingly worried about their financial stability amid economic uncertainties.
Political Polarization Sentiment varied significantly across political affiliations, with Democrats reporting a historic low of 33.9 and Republicans at 84.2. This polarization indicates differing perceptions of economic conditions based on political views.
Labor Market Anxiety About two-thirds of consumers expect rising unemployment in the next year. This concern persists despite stable jobless claims and a historically low unemployment rate of 4.2%.
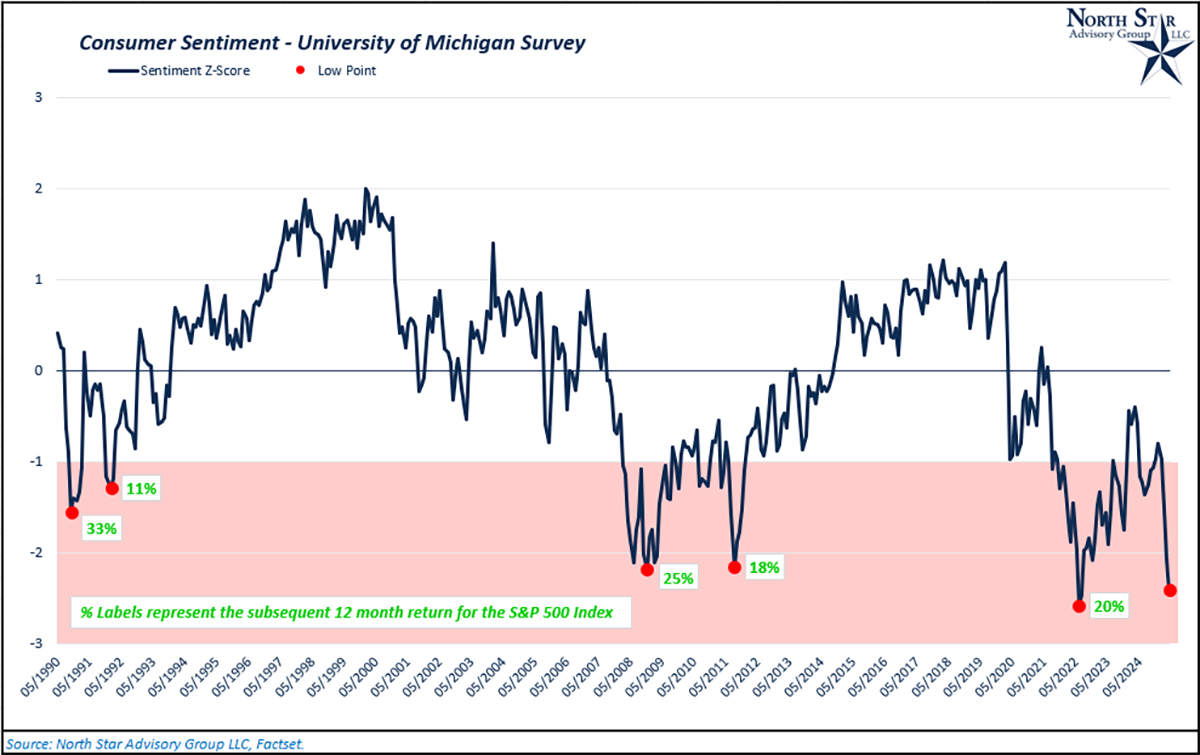
While the University of Michigan’s sentiment survey provides insightful information on the real economy and how households are feeling at a particular time, they historically have provided a countersignal for stock markets. Tracking the standardized level of consumer sentiment readings (number of standard deviations from the average reading), the market has typically shown strong positive returns when sentiment falls 1.5 standard deviations below its average. We’ve called out a few examples in the chart below. May’s preliminary reading puts the current standardized value of sentiment at -2.4. It’s important to note the distinction between hard data and soft data that can be influenced by behavioral biases (like this sentiment survey). One month of tariff volatility took sentiment lower than the global financial crisis when the S&P 500 cratered more than 50%, which doesn’t make economic sense.
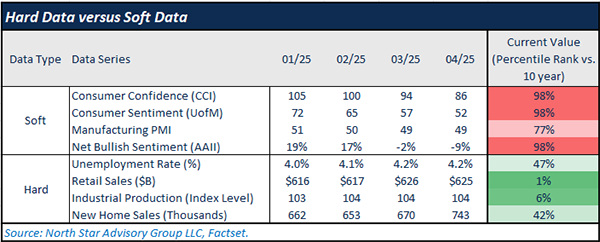
The table below summarizes key economic data series, divided into hard and soft categories. Three of the four soft data series declined meaningfully from January to April, with all four series at historically low levels compared to the past decade. Hard data shows an opposing (positive) trend.
Failed big, beautiful treasury auction
While NSAG has raised some concerns over U.S. fiscal policy in recent quarters, the bond market seemingly confirmed some of our underlying concerns on May 21st following the U.S. 20-year treasury bond auction.
On 5/21/2025, $16 billion worth of 20-year treasury bonds were offered at 5% to the market, which by most metrics was relatively unsuccessful. This auction had a bid-to-cover ratio of 2.46x, meaning that there were investor purchases of $2.46 for every $1 of bonds offered. While this may seem to indicate strong demand on its face, it is a decline from the average bid-to-cover ratio of 2.58x over the past 10 auctions. Additionally, while these bonds were offered at 5%, many investors entered bids at 5.047%, known as the “high rate”, and 41.02% of total bond sales in this auction were accepted at that high rate. In aggregate, May 21st’s auction was widely viewed as unsuccessful and showed signs of weaker demand for owning U.S. sovereign debt.
The broader market reaction told the story. On the same day, U.S. bonds sold off as the 10-year treasury yield rose from 4.48% to 4.58%, stocks (S&P 500) fell by 1.61%, and the U.S. Dollar Index fell by 0.56%. Outside of the longer-term fiscal obstacles that we face, this treasury auction’s failure falls at the lap of the Republican’s “big, beautiful bill” as investors are concerned over the passing of this bill adding further stress to the fiscal budget and future debt levels.
Some key components of this bill include;
Tax Reform
- Permanent extension of the Tax Cuts and Jobs Act.
- Increasing State and Local Tax (SALT) deduction cap from $10k to $30k.
- $10k tax credit on auto loan interest for purchasing American-made vehicles (cars, trucks, RVs, motorcycles, and ATVs) as long as their final assembly occurs in the United States.
- Increases child tax credit to $2,500 through 2028.
- “MAGA Savings Account” which provides $1k per child for families to invest.
- Remittance tax: 5% tax on money sent abroad.
- Increasing taxes on university endowments and potential to revoke tax-exempt status
Non-tax budgetary influences
- $150 billion in additional defense spending.
- $70 billion in border security spend.
- Stricter education assistance requirements for Pell Grants.
- Ends direct federal subsidized loans for undergraduate students.
- Various Medicaid reforms focused on stricter qualifications for funding/coverage.
- Reductions in clean energy tax credits, ends tax credits for electric vehicles reduces the timeline for solar.
One can debate each line item of the budget and argue over what spending is necessary or which tax reform might spur economic growth, but regardless of one’s feelings on these policies, the market’s unanimous take was that it will worsen our government’s annual deficit and debt position over time.
Moody’s Plays Catch Up
Last month, we examined the pressure on long-term sovereign interest rate levels after Liberation Day and the reasons for the bond market sell-off. Our data indicated that credit risk, rather than long-term inflation expectations, was being priced into long term government debt. Click HERE to read more.
A couple weeks later on May 16th, Moody’s (One of the three major credit rating agencies), lowered their credit rating from the top rating (Aaa) to one notch lower (Aa1). Their reasoning behind the downgrade included growing concern over the fiscal deficit and growing debt burden. While the reasons for concern are valid, and we’ve discussed them in previous Timely Topics issues, the actual downgrade itself is not very meaningful in our eyes.
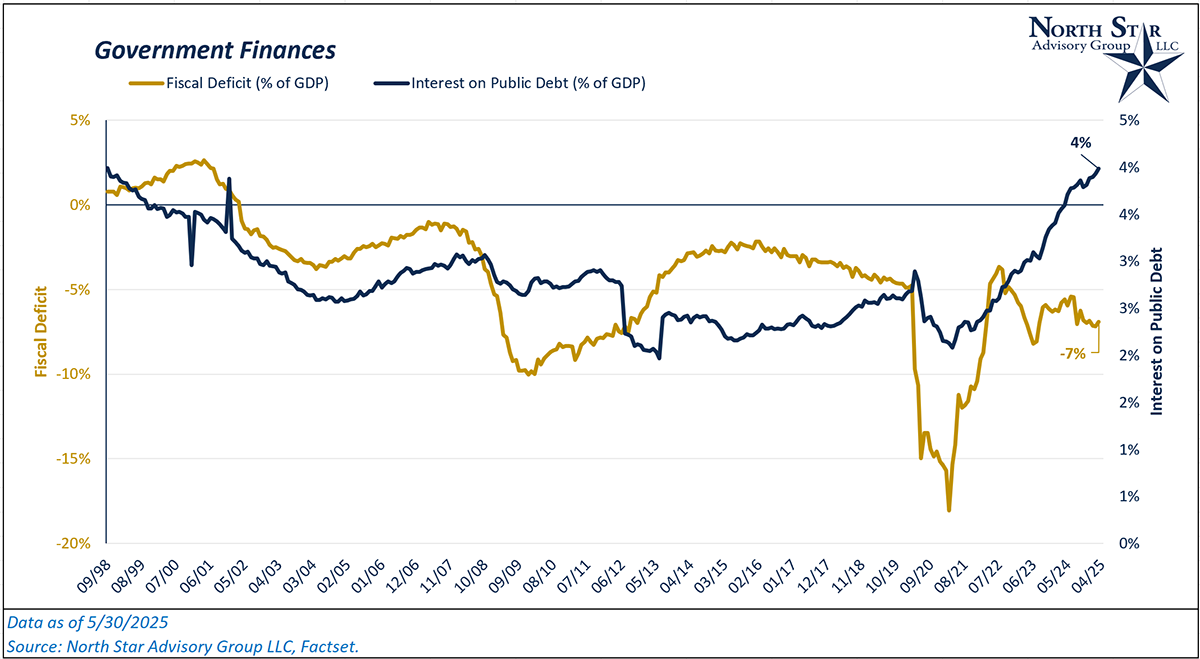
The other two major credit rating agencies (Standard & Poor’s, Fitch) had already downgraded U.S. sovereign debt in previous years. Standard & Poor’s lowered their rating in 2011 while Fitch lowered their rating in 2023. Moody’s downgrade was essentially playing catch-up to the other agencies. U.S. sovereign debt had already had its AAA rating stripped from them following the Fitch downgrade in 2023, when two out of three ratings agencies had knocked the debt one notch down. Moody’s action just confirms what we’ve already addressed and are aware of in the past, and that is that the U.S. government is on an unsustainable path fiscally. Over the past 12 months, U.S. interest payments have amounted to 4% of total nominal GDP and this number is estimated to be closer to 5% over the next 12 months. This number could improve through either lower interest rate levels or a reduction in overall debt. From an interest rate perspective, the Federal Reserve could lower rates, but as we’ve discussed numerous times, this will mostly affect the shorter end of the yield curve. From a debt perspective, we can’t paydown debt when our government’s fiscal deficit (or “cash flow”) is negative each year. As a % of nominal GDP, the fiscal deficit has continued to worsen over the past three decades.
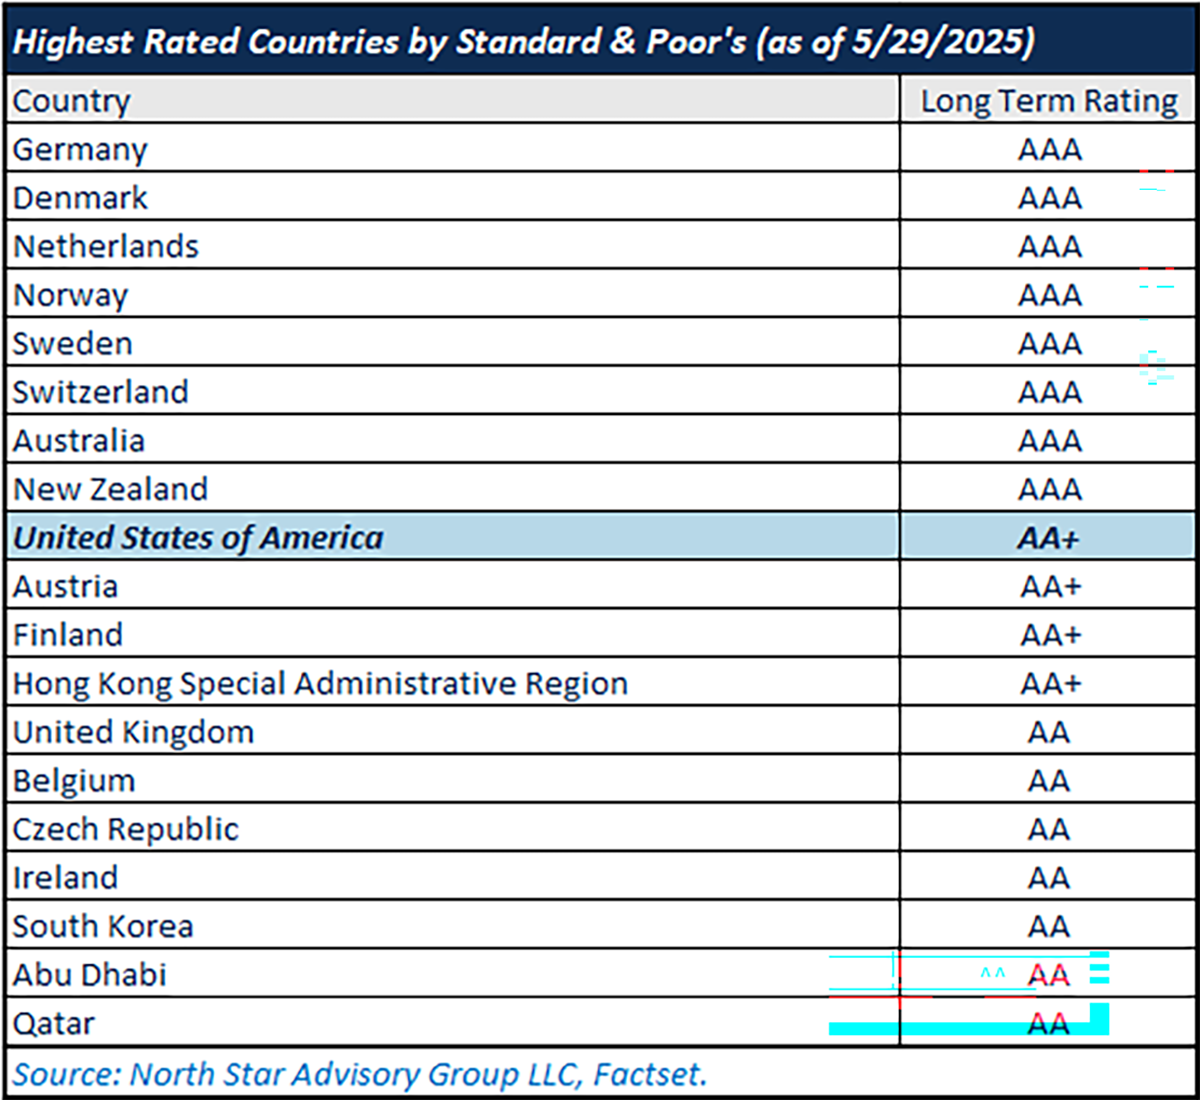
Only eight sovereign nations continue to carry the highest AAA rating from Standard & Poor’s. Six out of eight of these nations are in Europe, while two are in the Asian Pacific region (New Zealand & Australia).
Gold Rush Update
In March, we wrote about the outsized returns generated from exposure to Gold over the past 2+ years. Click HERE to read more. In our view, we view the strong performance of gold as a catch-up trade following the inflation crisis of 2022 and first half of 2023. In 2020 and 2021, many investors ditched gold and other precious metals for stocks, crypto, and other risky assets as the price of gold greatly lagged the return found in these assets. Even in 2022, despite rising inflation, gold finished the year flat and even experienced an intra-year decline of 22%, bucking the common thinking of gold as an inflation hedge. Strong performance in the next three years (+13% in 2023, +27% in 2024, and +25% year-to-date as of 5/30/2025) is partially a catch-up trend in our view as gold price returns have historically had positive correlation to inflation rates pulled forward by two years.
In recent weeks, we’ve had many clients inquire about investing in gold and adding exposure to this asset. While we don’t think the correct allocation to gold and other precious metals should be zero, we are cautious about gold’s outlook in the coming years following multiple periods of strong returns.
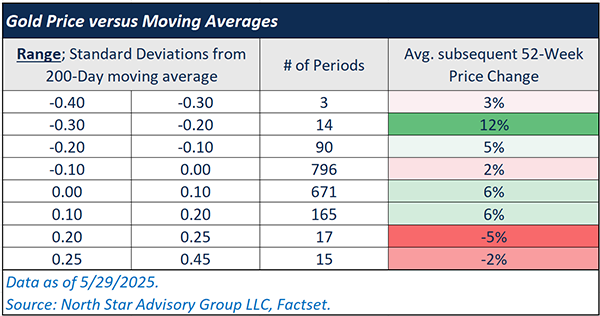
Using the Bloomberg Gold Index as our proxy for the global spot price of gold, gold prices have become very extended from a technical perspective in recent weeks. On 4/18/2025, the Bloomberg Gold Index hit a price level of 312 versus a 200-day moving average value of 287. Based on the volatility of gold, this put prices at 0.41 standard deviations above the 200-day moving average level, the second highest reading in the past 30 years. From 4/18/2025 through 5/30/2025, the gold index has been down by 0.3%, while the S&P 500 was up by ~12% over that same time frame.
Historically, when this index hits a level of 0.20 standard deviations or greater above its 200-day moving average, the forward 1-year price change has been flat to down on average (see table below).
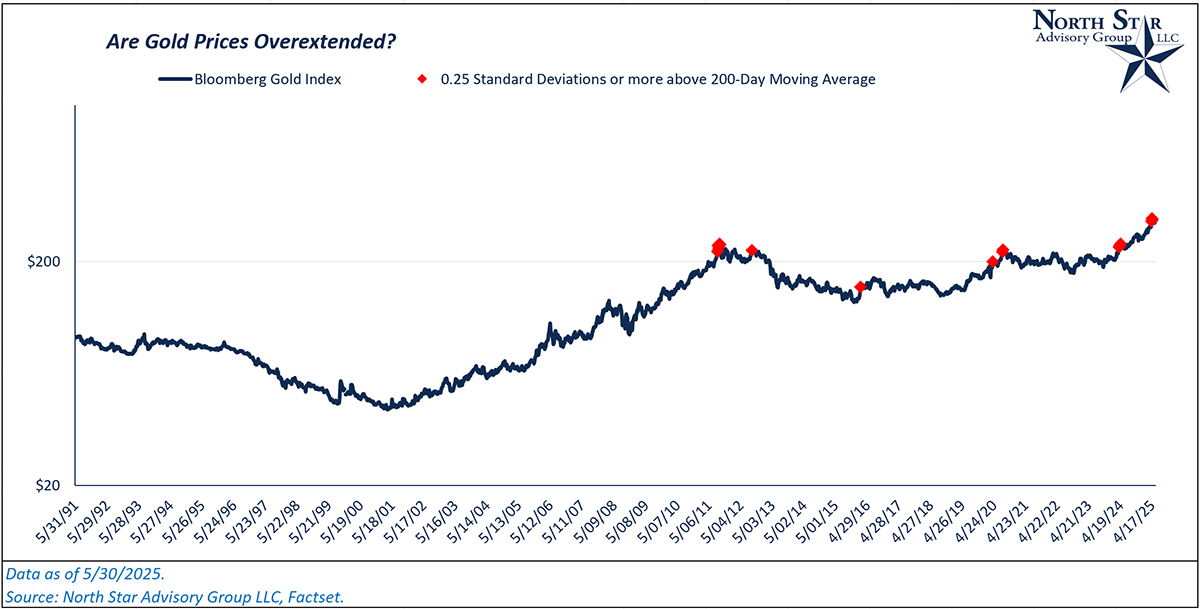
Looking at the historical chart, you’ll notice that periods when gold prices became very extended (0.25 standard deviations or more) coincided with different periods of panic in the market. Prices didn’t necessarily react immediately to inflation specific shocks. Gold prices soared from 2008-2010 during the fallout from the housing crash and in the summer of 2020 following the initial Covid shock. Both of these periods were followed by poor price returns for gold.
NSAG News
Rachel Smylie successfully passed the Series 65 examination in May 2025. This accreditation authorizes individuals to serve as investment adviser representatives, covering critical subjects necessary for offering informed investment advice to clients. Rachel's continuous educational accomplishments highlight our firm's commitment to personal development and professional excellence.

Nick Stern returns to NSAG full time in June 2025 after graduating in May 2025 from Bowling Green State University with a Bachelor of Science in Business Administration, with specializations in Finance and Financial Management Services. During the year after joining NSAG, Nick plans to continue his educational pursuits by sitting for the necessary exams for the Ohio Notary, Series 65 exam, Ohio Insurance exam for Life and Health, and Certified Financial Planner®. Nick stated that “seeing how NSAG impacted as many lives as it did during my short summer internship solidified my decision for a career at NSAG after graduation to pursue my passion for making a difference and helping everyone that I can, however I can.”

In April, Brian represented North Star at the Global Trends Events (GTE) Wealth Management Conference in St. Petersburg, Florida. This three-day conference enabled Brian to engage with more than fifteen asset management companies to deliberate on economic trends, investment strategies, and various other pertinent topics. These engagements included dialogues with portfolio managers from both the public and private sectors.
This marks the third GTE conference that Brian has attended since joining North Star in 2021. Conferences like this one remain invaluable for generating ideas relevant to constructing client portfolios. Although North Star's research capabilities are robust internally, it is advantageous to validate our findings and confirm our analyses through comprehensive discussions with external industry experts.
Where will the stock market go next?
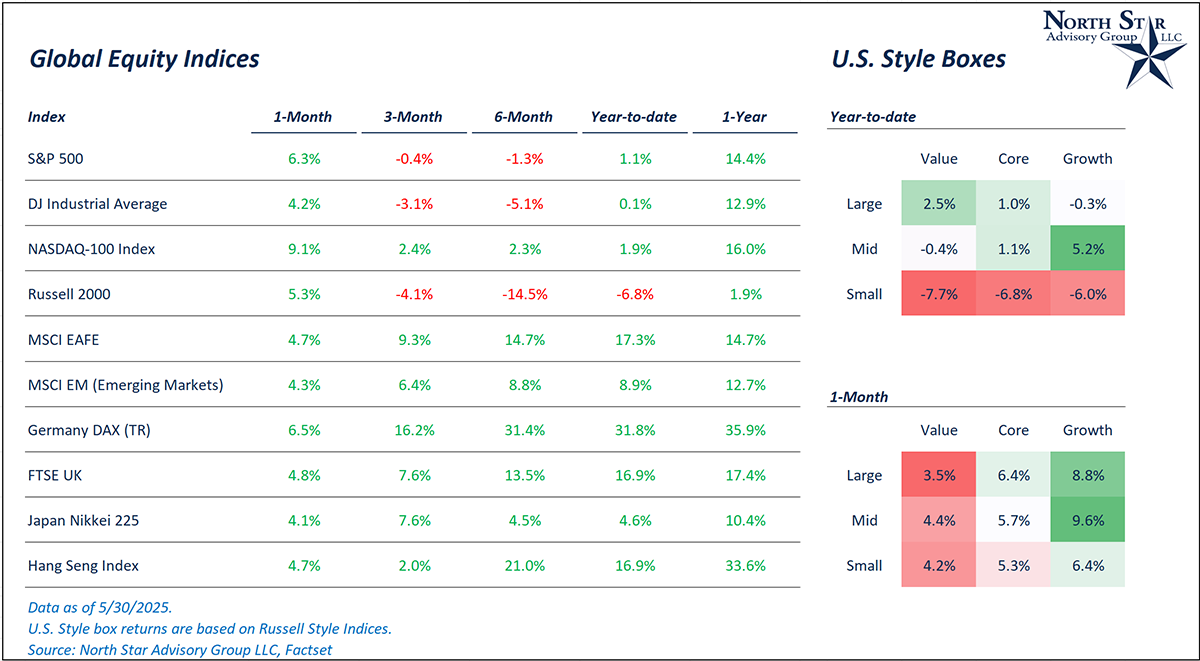
The past month saw global equity markets continue to rally after their partial reversal from liberation day in April. In the month of May, U.S. large cap was up 6.3%, international developed was up 4.7%, and emerging markets were up 4.3%. This positive momentum followed the V-shaped fall and recovery of stock markets in April caused by tariff policy uncertainty.
With April’s recovery and the continuation of the rally experienced in May, the S&P 500’s valuation (based on trailing twelve months’ price/earnings) has risen back up to ~24x, slightly down from 24.7x at the beginning of the year. This places the index’s current valuation ratio at the top 11% of all periods over the past 25 years. We continue to expect returns to be driven primarily by earnings growth and not multiple expansion, especially following two calendar year periods where the expansion of the price/earnings ratio contributed to greater than half of the index’s return.
With the bulk of Q1 earnings season behind us, S&P 500 EPS has been better than expected in aggregate. Coming into the year, S&P 500 EPS in Q1 was expected to be up ~11% versus Q1 of 2024. Actual results showed that Q1 growth was closer to 12.8% relative to Q1 2024, with 482 of the 504 index constituents reporting as of 5/30/2025. With that being said, Q2’s growth expectations have shrunk. The market is now expecting ~4.7% growth after expecting 11.4% at the beginning of the year. This decline in expectations is largely due to the tariff uncertainty that has gripped the market since 4/2/2025.
Reciprocal tariffs have been paused, conversations with China have begun, and a potential EU tariff of 50% was announced and then delayed within 48 hours. There are many more instances of potential trade deals being made or extensions on tariffs being implemented, and it points to the fact that the tariff endgame will likely not look like how most thought it would on liberation day, a view that North Star has been adamant about. Most notably, on 5/28/2025, a U.S. trade court struck down Trump’s reciprocal tariff strategy (the administration has already filed an appeal which was granted the next day on 5/29/2025). We continue to expect heightened volatility throughout the remainder of the year as trade talks and policy continue to shift rapidly due to negotiations and legal conflicts. Given that the actual tariff implementation is much more muted than feared (so far), we believe companies have a good chance to beat on their earnings projections in Q2. But we expect valuation levels to continue as a headwind for the U.S. stock market’s ability to achieve outsized gains as it has in recent years.
We are passionately devoted to our clients' families and portfolios. Contact us if you know somebody who would benefit from discovering the North Star difference, or if you just need a few minutes to talk. As a small business, our staff appreciates your continued trust and support.
Keep sending your questions for a chance to be featured in next month’s Timely Topics.
Best regards,


Mark Kangas, CFP®
CEO, Investment Advisor Representative