


Each month we ask clients to spend a few minutes reading through our newsletter with the goal of raising their investor IQ. In May's Timely Topics, we’re unpacking Liberation Day’s impact on the stock markets, bond yields, deficits and the supply chain. As a reminder, we announced Monarch in April’s Timely Topics our new free premium app designed to combat inflation and we encourage clients review the benefits as we continue to roll out the new program.
- Unpacking Liberation Day
- Yield pressures
- Deficits: fiscal versus trade
- Tariff supply chain impact
- 529 Month
- Where will the stock market go next?
Unpacking Liberation Day
In last month’s Timely Topics, we discussed the expectation for higher volatility in both stock and bond markets. This has been a theme we’ve been discussing since November’s election. Despite the volatility expected from shifting policy narratives and social media posts, historical data showed us that on average, a unified government typically led to higher stock volatility and lower (but still positive) returns. We published last month’s issue one day before President Trump came out holding the big placards with even bigger tariff rates, and needless to say, this move did not disappoint in increasing volatility.
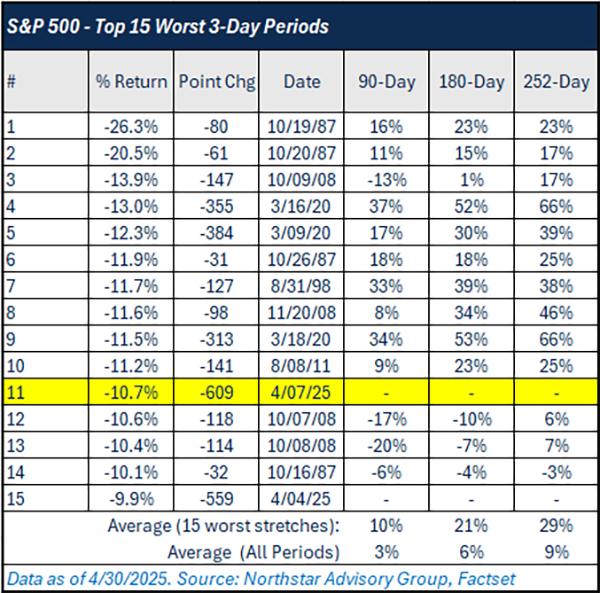
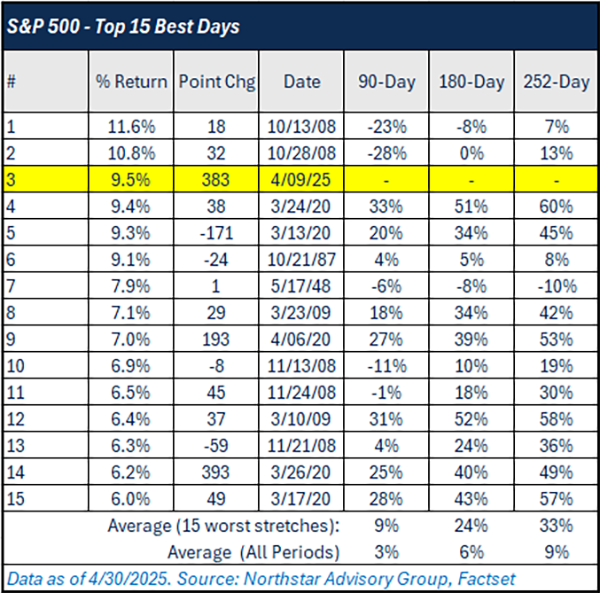
What followed was a historic rise in volatility which occurred almost in the blink of an eye. From April 2, through April 7, the S&P 500 experienced the 7th worst 3-day period of returns since World War II, based on percentage change. On April 9, the S&P 500 followed up this drawdown with the third largest single-day percentage gain since World War II (+9.5%). The daily volatility over this short time frame was accompanied by high levels of intra-day volatility. Whether the market would close up or down on a given day, we would see swings from -3% to +3% (and vice versa), due to the barrage of headlines and narrative shifts coming from the Trump 2.0 Administration.
Historical levels of negative or positive volatility have generally led to higher returns for stocks over the next 90-, 180-, and 252-day periods. See the average subsequent returns for the S&P 500 Index in the two tables below.
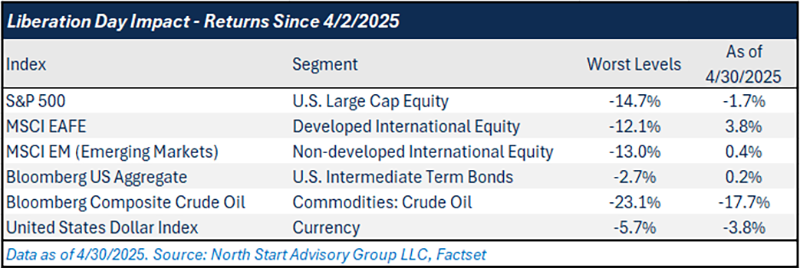
Liberation Day sent shockwaves across the global capital markets. From April 2 through April 30, U.S. stocks are down ~2%, international developed stocks are up ~4% (returns measured in USD), crude oil has fallen ~18% and the U.S. Dollar Index is down 4%. In aggregate, these market moves signaled an overall fear of an economic slowdown/recession caused by a trade war but are well off of their worst levels.
The bond market is the only market that has not priced in slowdown fear. Interestingly enough, the initial reaction was a sharp drop in the 10-year treasury yield and rally in bonds markets, which is expected in an economic slowdown. That said, it was short lived. The 10-year yield fell from 4.2% to ~3.8% and quickly reversed back to 4.5% in just a few days. What does this signal to investors? Initially, we should think that this means the markets are fearful of inflationary pressures caused by tariffs. Although, the reversal in interest rates may mean more than just inflationary fears and a structural problem with our national debt that we will discuss in further detail in the next section.
Last month, we included a table showing the prior 10% corrections on the S&P 500 and how many of those corrections turned into either a 15% correction or 20% bear market drawdown. Historically, about half turned into 15% corrections and a quarter turned into bear markets over the next 90 days. On the morning of April 7, the index broke through the 20% barrier but closed off of those levels. As of April 30, the index recovered a chunk of its losses and is ~9% off of its high point of the year, capping off the most volatile month since March 2020.
Yield Pressures
As mentioned in the last section, Liberation Day provided historical levels of interest rate volatility. As global markets quickly priced in an economic slowdown, the 10-year treasury yield fell, along with stock prices and commodity prices. Despite some relief in both stocks and commodities, treasury yields have violently reversed higher and even hit 4.5%, above levels seen on Liberation Day.
There had been “conspiracy theories” around the Trump administration’s tariff strategy that included their willingness to throw the economy into a recession to bring down interest rates as the Federal Government has a large chunk of debt (~$9 trillion) that needs refinanced in 2025. We put quotes around the word conspiracy, although this plan was later confirmed via a Truth Social post by Trump himself. Whether it was the primary goal or tangential strategy, he laid claim to it. So, rates reversing and moving higher at the same time as stocks fell in price, created a worst-case scenario for the Administration. They even admitted that the bond market played a role in their decision to postpone reciprocal tariffs for 90 days. This theory is evidenced further through Trump’s continued calls for the Federal Reserve/Jerome Powell to lower interest rates. If the Fed was to cave and lower rates at their next meeting it would primarily affect shorter term borrowing rates (not the 10-year rate).
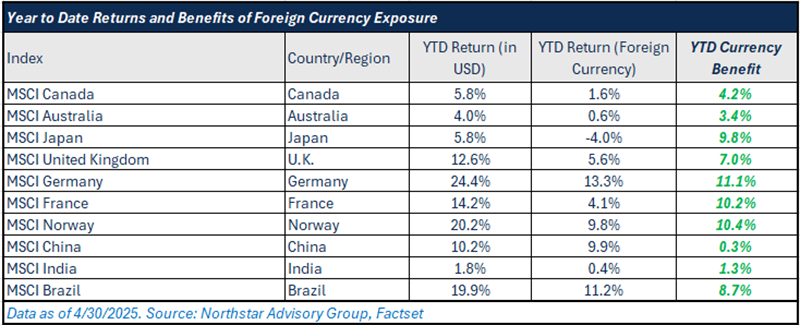
Digging into what has driven the reversal in the 10-year yield, data shows that it’s not necessarily inflation pressures from tariffs driving rates upwards and its more likely credit risk being priced into long term treasury bonds. The inflation premium for long term bonds, measured as the spread between a treasury bond and a treasury inflation protected bond (aka the “TIPS spread”), has fallen since Liberation Day, despite overall yields moving higher. (We wrote about the TIPS spread and its correlation to future inflation in June 2023). A falling TIPS spread is one indicator that the move higher in yields is a true re-rating of U.S. government debt and not simply tariff inflation being priced into bonds. Another indicator is the falling U.S. dollar relative to foreign currencies, which points to capital flowing out of treasury bonds. This move has benefited our domestic clients who are invested in international markets (see table below). Year-to-date, the U.S. Dollar Index has fallen 8.3%. Additional uncertainties, such as quick policy shifts, the threatening of Federal Reserve independence, and continued federal budget/debt issues have cracked some of the unwavering trust in U.S. markets. This is an unwind of the American exceptionalism trend we wrote about in March.
It’s likely that if yields continue to rise from selling pressure on treasury bonds, the Federal Reserve’s hand will be forced, and they will have to pivot to step in as a buyer of these bonds. This means more money printing and eventually increased inflation down the road. In this scenario, you will want to be a long-term investor in risky assets that benefit from inflation, such as stocks or real estate.
Fiscal deficit versus trade deficit
In the month of April, the Trump 2.0 Administration has been quoted saying the country needs to “take its medicine.” This thought of “taking our medicine” has been primarily used in the context of the administration’s tariff strategy and refers to experiencing short-term pain for long term gain. Their view is that rebalancing global trade and reducing trade deficits will effectively help the country become “rich again,” alluding to the ballooning government debt, which is the true problem that needs remedied. From an economic perspective, we think that this is a misguided fix to the overall debt issue. Running a trade deficit (or surplus) does not directly affect the government’s fiscal budget or overall debt levels. There can be some indirect impact, depending on the trade strategy that is implemented.
When drawing a comparison between the U.S. government and the average American household, the debt issue becomes clear. A household that spends more than it earns year after year is going to continue to accumulate a larger personal debt balance. There are only two ways to reduce this debt: 1.) increasing the household’s income or 2.) reducing the household’s spending habits so that positive cash flow can be generated each year to pay off that personal debt.
In 2024, the U.S. Federal Government spent ~$6.9 trillion while having income of only ~$4.9 trillion, generating a $2 trillion budget deficit. The extra $2 trillion that was spent did not appear out of thin air as treasury bonds were issued to finance this spending, adding ~$2 trillion to total debt.
So, how might a change to our trade strategies have an effect on the budget and ultimately the debt level? You might say, “if we implement an aggressive tariff plan, we can increase income to offset budget deficits.” In 2024, the U.S. imported ~$444 billion worth of goods from China and ~$3.45 trillion from the rest of the world, ~$3.9 trillion in total. So, let’s say we tariff China @ 145% and the rest of the world @ 10%. Assuming there is no hit to volumes or growth projections (the most unlikely scenario), revenue would increase by ~$990 billion, almost cutting the 2024 deficit in half. This does not account for additional costs for the government via subsidies to farmers, automakers, etc. While this strategy takes out a large chunk of the deficit, the government is still unprofitable. On the other hand, what if we can onshore every product that we imported? That would be an additional $3.9 trillion worth of revenues generated within the U.S. Being extremely generous, let’s assume a 50% profit margin and a 21% corporate tax rate. This scenario increases government revenue by ~$400 billion, cutting the deficit by ~20%. In either case, spending remains the prominent issue if we continue on this trajectory moving forward.
Let’s examine one more revenue generating scenario. If Kamala Harris had won in November, we’d likely be having aggressive tax conversations instead of tariff conversations. So, what would a scenario look like if we aggressively increase taxes across both businesses and residents? In 2024, corporations earned aggregate profits of ~$3.8 trillion and paid corporate taxes of ~$490B, an effective corporate tax rate of ~12.8%. Households had an aggregate income of ~$24 trillion and paid income taxes of ~$3 trillion, an effective income tax rate of ~12.6%. To be aggressive, let’s raise both the effective corporate and income tax rates by 5%. Federal government revenues would increase by ~$1.4 trillion, cutting the deficit by ~68%. Still, the Federal Government is unprofitable.
None of these aggressive revenue generation strategies bring the government to profitability and in all discussions, we assumed no impact to economic growth, which would be impossible given the amount of dollars being sucked out of corporations and citizens to generate more revenue for the government. However we slice it, the underlying fix continues to reside in spending patterns. Until something drastically changes, we continue to recommend stocks over bonds for clients with long-term investment horizons as risk assets (stocks) benefit from positive inflation over the long run. The Federal Reserve will have to continue to be the primary source of liquidity for our nation.
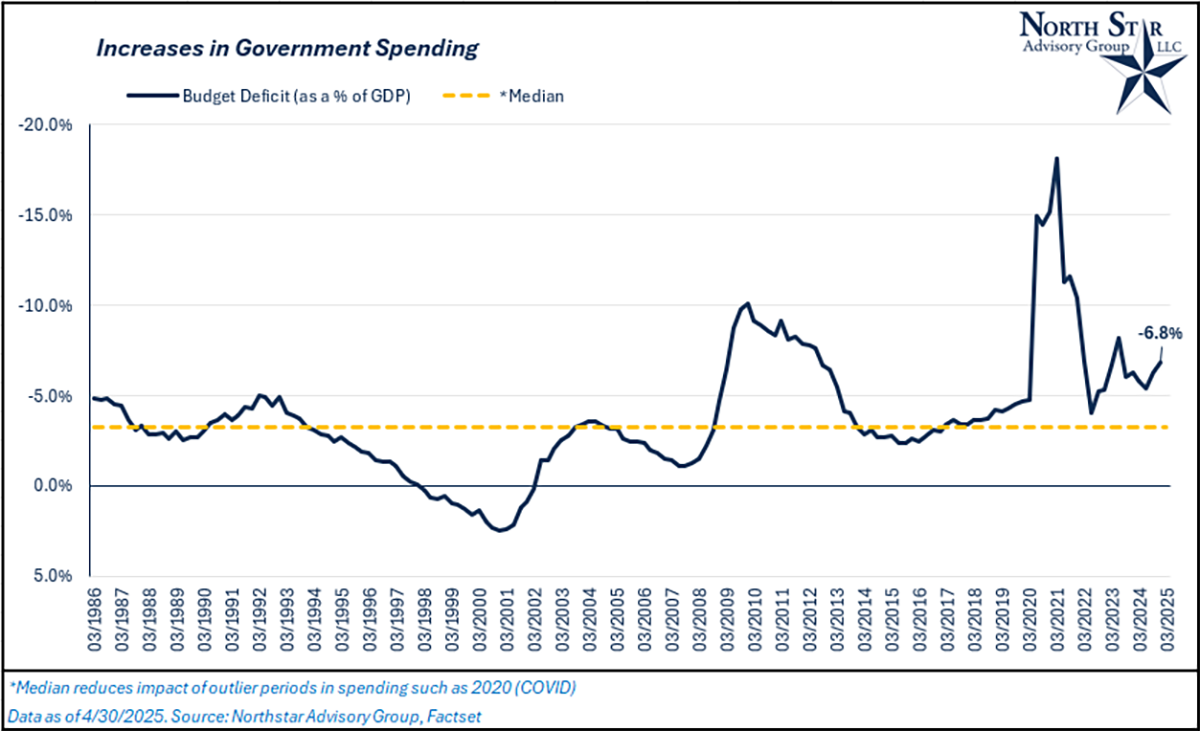
Currently, the budget deficit represents ~7% of annual GDP and this number has historically been closer to 3-4%. We’d expect this number to be higher during periods of economic stress (see COVID or 2008), but we have been running at an elevated rate of spending in every quarter post-Covid with no recession and historically low unemployment rates. Economically, this is not sustainable in the long run.
Tariff supply chain impact
We expect there to be short-term supply chain disruptions caused by the volatility of the administration’s tariff policy. Many businesses will likely accelerate imports as the 90-day reciprocal tariff pause comes to an end in mid-summer. We saw an acceleration for certain goods being imported and purchased by consumers prior to April 2. Auto dealerships saw an influx of customers as well as Apple Stores and other durable goods that would be subject to higher tariffs on China.
Moving forward, normal operations for most businesses will likely be very volatile as management teams try to balance multiple scenarios. There is a scenario where tariffs remain intact with high rates and demand slows significantly, and an opposite scenario where the majority of tariff plans are scrapped as trade deals come through and demand stays strong. On top of these two scenarios, business leaders are split on whether they should be re-shoring and diversifying their supply chains away from the worst trade actors (such as China) or whether they should sit on their hands and wait as policy shifts play out. It’s important to remember that while there is still a heavy reliance on Chinese manufacturing, a lot of American businesses did diversify portions of their supply chain away from the country in the aftermath of Covid-19 related supply chain shocks. In aggregate, the continued uncertainty around long term tariff policies will likely cause volatile inventory levels for businesses over the next few quarters.
Goods that are brought across borders while the reciprocal tariff pause is in place will not be subject to tariffs and won’t need to be sold at elevated prices to maintain the unit profitability of those products. With that said, demand for normally priced goods may not necessarily stay intact. Consumers could start to feel pressure in other parts of their budgets, or they may simply push out discretionary purchases and opt for savings if economic uncertainty persists, creating a self-fulfilling prophecy.
As each quarter passes, we plan on tracking inventory turnover and days of inventory on hand for each sector to identify shifts in operating trends caused by tariff uncertainty.
We would expect that that ability for companies to pass on tariff costs to consumers will depend on the product. It’s likely that luxury good sellers will pass on close to 100% of any tariff related cost to their customers as these types of consumers are less price sensitive. For example, Hermes and Ferrari have announced price increases in the past month. The extent to which a seller can pass on the cost will depend on its customer’s price sensitivity at each level from luxury goods to basic goods. Remember, the tariff cost is applied on the imported value of a good, not the retail price. For example, a $40,000 dollar car that has a 10% tariff does cost an extra $4,000. The 10% tariff will be based on the price paid to import that vehicle into the U.S.
529 Month
NSAG's annual tradition in May is to update clients on college planning strategies. In 2025, there have been few changes to these strategies and related laws and rules.
In 2025, the federal annual gift tax exclusion increased to $19,000 per individual ($38,000 per couple), allowing for larger tax-free contributions to 529 plans. Changes from 2024 remain impactful, including the ability to roll over up to $35,000 of unused 529 funds into a Roth IRA for the same beneficiary (under SECURE 2.0) and the FAFSA no longer counting distributions from nonparent-owned 529 plans as student income, which can boost financial aid eligibility. Additionally, Ohio House Bill 125, still under review, proposes updates to state tax deductions for 529 and ABLE account contributions, which could affect tax benefits for Ohio residents.
Ohio House Bill 125 proposes to increase the state income tax deduction for contributions to 529 college savings plans and ABLE accounts. Currently, married couples filing jointly can claim a $4,000 deduction per beneficiary. The bill seeks to raise this limit to $8,000 for joint filers, effectively eliminating the "marriage penalty" and aligning the deduction with that available to married individuals filing separately. Additionally, the legislation would index the deduction limits to inflation, allowing them to adjust over time. As of now, the bill has been passed by the Ohio House and is under consideration in the Senate.
In May of last year, we discussed:
- The pros and cons of using different account types to save for college (click HERE to read more).
- Rolling a 529 into a Roth IRA (click HERE to read more).
There haven’t been any changes to these topics, so we are re-linking the discussions from last year as a refresher for clients.
We also discussed education inflation rates. In March 2024, this cost was up by 2.4% versus March 2023. In the previous year, the price increase was 3.6%. As of March 2025, education costs are up by 2.3% versus one year ago. In general, we are seeing a disinflation (lower but positive increase) in education costs over the past two years.
Where will the stock market go next?
We believe the U.S. stocks (the S&P 500) will continue to experience some volatility in the short term and be range bound until there is meaningful progress on trade deals. On April 1st, one day prior to Liberation Day, the S&P 500 closed at 5,670. The intra-year low for the index during peak tariff fear was 4,835. This is likely the range in which the index will trade in the near term, while investors wait for further global trade updates.
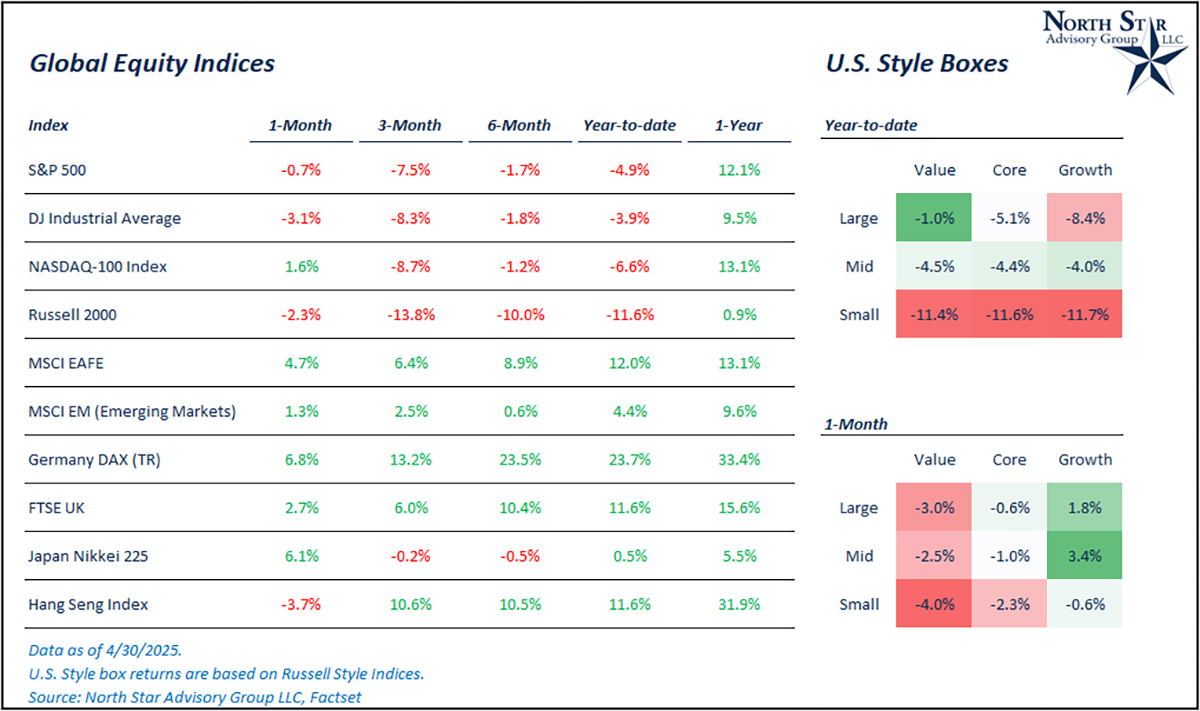
In April, the S&P 500 fell 0.7% while international stocks (MSCI EAFE) gained 4.7%, buoyed by currency gains as the U.S. dollar fell 4.6%. April was the most volatile month for U.S. stocks since March 2020, although volatility levels did not eclipse Covid’s high. On a U.S. dollar basis, international stocks continue to outperform in 2025 with the MSCI EAFE index up 12% and the MSCI Emerging Markets index up 4.4%, while the S&P 500 is down ~5%.
While we expect that stocks in the short term will be primarily driven by the direction of tariff strategies, Q2 earnings season will also play a major role. While we are still in the early innings of q2 earnings season, we aren’t seeing companies dramatically lower their guidance numbers in response to the shock of tariffs. If anything, we are mostly seeing companies widen the range of outcomes for their sales and earnings guidance, which is more than understandable in this environment. On April 30th, Microsoft and Meta Platform posted earnings beats for Q1 while slightly raising their current quarter guidance numbers. This sparked a rally in U.S. stocks the following day despite a barrage of negative economic data releases.
Real GDP was negative in Q1, the GDP Chain Price (inflation gauge) was hotter than expected in Q1, ADP Employment was lower than expected for April, and initial unemployment claims were higher than expected. While these important indicators were negative in aggregate, one month of data does not make a trend. A lot of focus was put on the quarter over quarter decline in Real GDP of -0.3%. If we look one level deeper, there was a spike in import values during the month of March as companies tried to front-run any potential tariffs, negatively impacting GDP. With the reciprocal tariffs still paused, we could see a continuation of this trend over the next couple of months. Although, we don’t believe this will be a structural trend in the long run.
We are passionately devoted to our clients' families and portfolios. Contact us if you know somebody who would benefit from discovering the North Star difference, or if you just need a few minutes to talk. As a small business, our staff appreciates your continued trust and support.
Please continue to send in your questions and see if yours get featured in next month’s Timely Topics.
Best regards,


Mark Kangas, CFP®
CEO, Investment Advisor Representative