


Each month we ask clients to spend a few minutes reading through our newsletter with the goal of raising their investor IQ. We are focusing March’s Timely Topics on American Exceptionalism, gold, and the current meme coin craze.
- American Exceptionalism
- Gold rush
- Chasing rainbows
- Peace talks in Riyadh
- The use of tax credits to fund private school
- Where will the stock market go next
American Exceptionalism
NSAG has been discussing the long-term opportunities that we believe exist within international and emerging stock markets over the past couple years. Over past decade plus, U.S. markets have dominated the global financial landscape in major asset classes including bonds, stocks, and currency. The dominance in financial markets for the U.S. has been well justified and primarily driven by technological innovations within the country. Whether it’s cloud computing, the gig-economy, or artificial intelligence, the U.S. has led in innovation and these new technologies have re-shaped industries, leading to continued increases in demand for investment in the U.S. On top of this innovation, the Federal Reserve has also been stimulating the economy for the majority of the past decade, and the U.S. dollar has strengthened consistently relative to a basket of global currencies. These trends in aggregate have been labeled as “American Exceptionalism.”
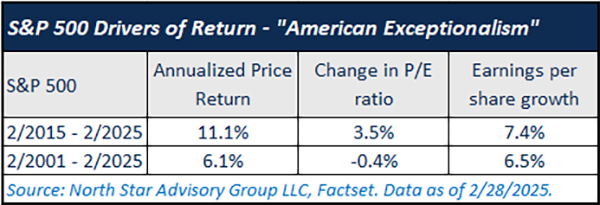
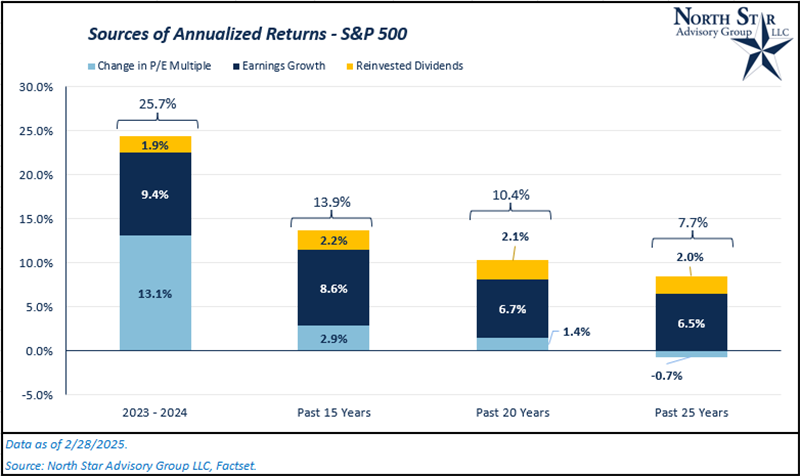
How do we visualize this trend? We can simply observe valuation multiples over time. Over the past 10 years, the S&P 500 Price Index has increased on an average annualized basis by 11.1%, as of 2/28/2025. Breaking down 11.1%, earnings have grown at an average annualized rate of 7.4%, and the price-to-earnings ratio has increased by 3.5% annualized. The key to visualizing this trend is within the price-to-earnings ratio. When this value is increasing over time, it is a testament to investor’s preference for one asset (U.S. stocks) over another asset (international and emerging stocks) that holding all else equal, have the same earning potential. U.S. bonds have also outperformed international bonds over the same time periods, primarily due to the appreciating U.S. dollar. Assets can’t rely heavily on an increasing valuation multiple forever (or an asset will find itself in a “bubble”). If we expand the timeframe to the past 25 years, the S&P 500 Price Index has only increased at an average annualized rate of 6.1%. Earnings grew at an annual rate of 6.5%, but the price-to-earnings ratio fell by 0.4% annually (see table below). During these 25 years, the U.S. has been the largest and most innovative economy the entire time (“exceptional” the entire 25-year period). Breaking down performance numbers over longer time frames, however, is evidence of an asset’s inability to rely heavily on valuations as they tend to be mean reverting in the long run.
While the U.S. has been clicking on all cylinders over the past decade, international markets have not been helping themselves. A few major headwinds include; general over-regulation in Europe, Russia-Ukraine War, Israel-Palestine War, deflation and over-regulation in China, and a rising U.S. dollar.
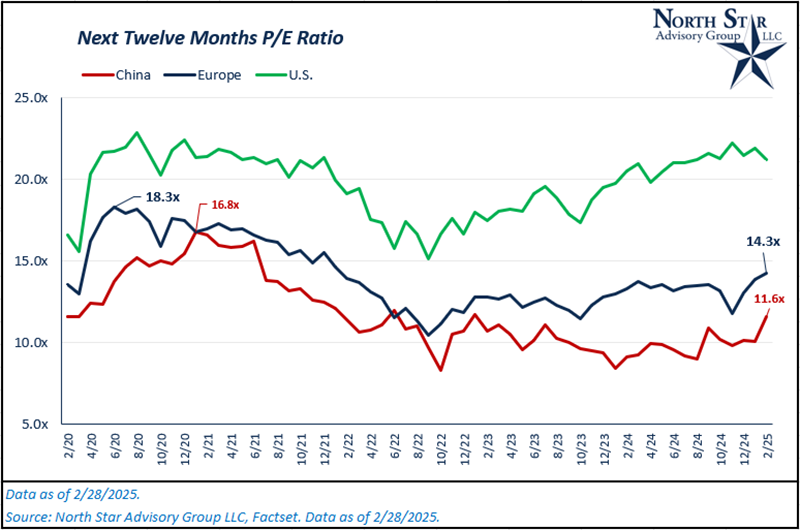
Given all of these headwinds, it’s no surprise that dollars have fled international markets over the past few years, and we’ve seen a collapse in valuation multiples.
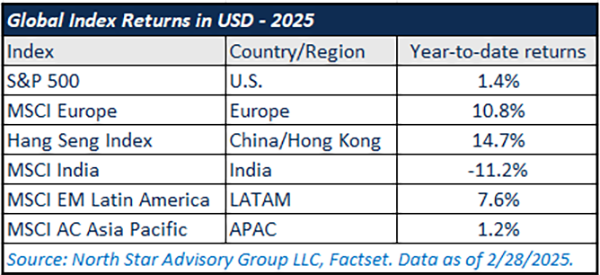
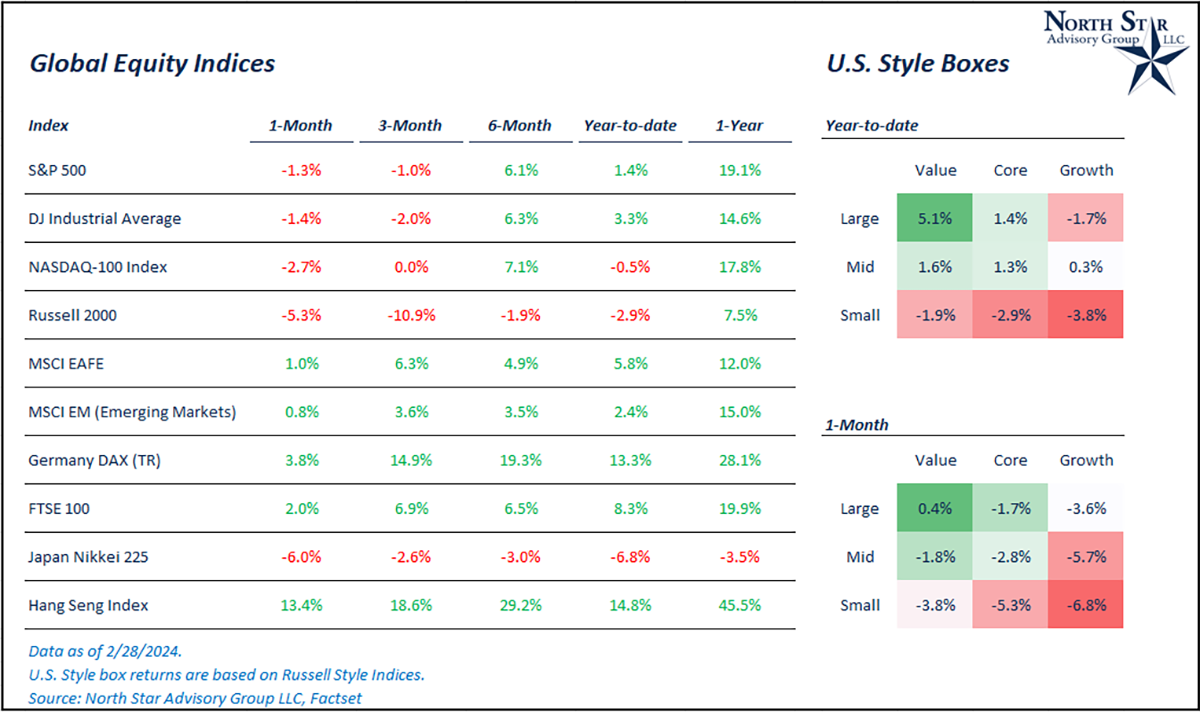
Looking forward over the next five years and beyond, we see an opportunity for higher growth in markets outside of the U.S. given their lower valuation profiles and the potential for a “re-rating” upwards of valuations. Any re-rating won’t happen without a catalyst. Already in 2025, we’ve seen a few developments that point to improvements in investing landscapes. Starting with China, the Chinese Communist Party has shown a consistent effort to boost sentiment through lower state-driven pressures on corporations (Jack Ma returns to the public eye), stimulative monetary and fiscal policy, AI development, and government-backed incentives for participation in Chinese stock markets. In Europe, there is light at the end of the tunnel for the Russia-Ukraine conflict, France/Netherlands/United Kingdom have announced various investments into AI data centers (pushing for innovation), and sentiment is stabilizing. More broadly, data localization is increasing in focus for countries outside of the U.S. For example, India will likely be the largest data producer of any country over the next decade simply due to their population and development trends. Data center investment will be critical within the country of India , as a large chunk of that data cannot leave the country and be stored somewhere in Silicon Valley. Similar data localization trends exist in Southeast Asia where population trends are strong. Given these few examples, the market is taking notice seen through the year-to-date performance for various markets (see table below). We continue to believe clients will benefit from owning a globally diversified stock portfolio in the long run.
Gold rush
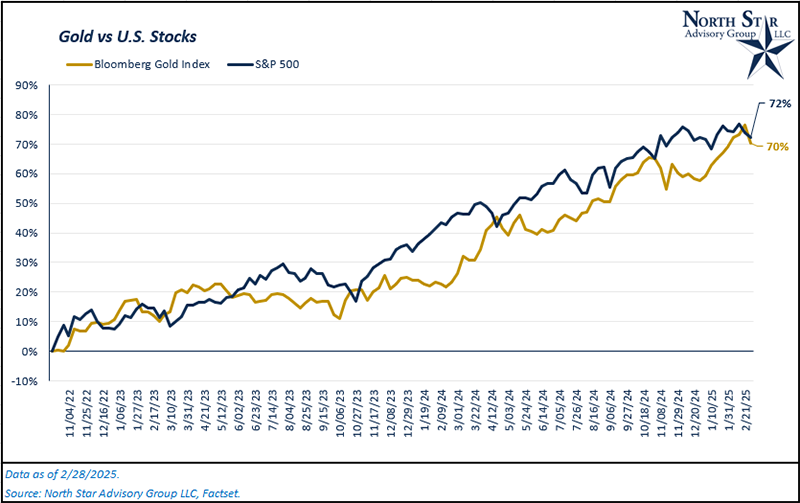
Since the U.S. stock market bottomed in October 2022, the price of gold has essentially kept pace with the S&P 500. From 10/21/2022 through 2/28/2025, the S&P 500 has risen 72% cumulatively, followed closely by the Bloomberg Gold Index at 70%. This has been a surprising development in the markets, given that stocks and precious metals are two distinctly different asset classes whose values are driven by different factors. In the long run, stock returns are driven primarily by economic growth (real growth + inflation) and to what degree economic growth falls to public company’s bottom lines (earnings growth). Gold, on the other hand, is known as a “safe haven” asset that typically appreciates and outperforms stock markets during periods of economic stress. Gold is also used as a long-term inflation hedge, but this use case doesn’t typically work well over periods less than 3 years (We wrote about this in March 2022’s timely edition).
Gold prices began their run AFTER inflation peaked in summer 2022. So, what could be driving this demand? Since October 2022, the monthly percentage change in gold prices has been negatively correlated with the month-to-month percentage changes in U.S. headline inflation. Additionally, the weekly percentage changes in gold have shown ~0 correlation to the CBOE Volatility Index (ruling out “safe haven” asset as the demand driver over the last two years) and negatively correlated (-40%) with the U.S. Dollar Index.
Other precious metals, like silver or palladium, have industrial use cases in electronics and technology. Gold’s primary consumer use case is in jewelry. So, has there been a spike in jewelry demand or a collapse in gold supply? Supply has gradually increased over the past couple years due to increased mining activity, but this growth in supply has been overshadowed by the increase in overall jewelry demand, heavily driven by consumption in China and India. This is likely one of the driving factors in the recent strong performance of gold as an asset class.
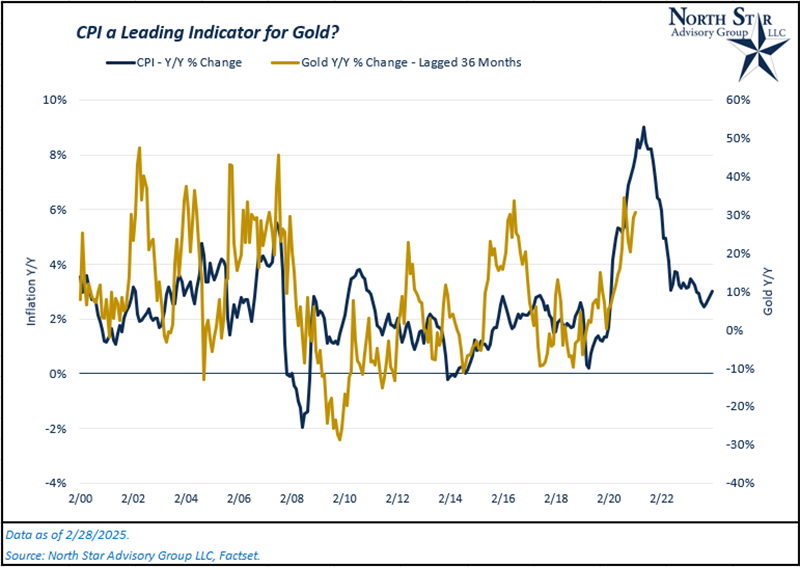
Lastly, there could be a bit of a “catch up” trade happening for gold post-2022’s inflation crisis. As we mentioned, gold is typically not directly correlated with inflation in real time, but it is possible that the price of gold has a significant lagged demand after inflation spikes. In the chart below, we looked at the year-over-year change in inflation versus gold prices and lagged the change in gold prices by 36 months. These datasets had a positive correlation of ~31%. While this might not be a strong correlation in practice, it’s stronger than all other relationships we measured. This lagged relationship starts to make more sense as you think about some of the consumption over the past couple of years, excluding general jewelry demand. Consumers have been purchasing bars of gold on a retail level and there have been many marketing efforts encouraging these purchases (think Costco selling gold bars in 2024). The marketing effort has been pitching gold as safe haven asset and inflation hedge, but the actual price of gold is not correlated with either CPI or market volatility in real-time. It could be that consumers felt the pain of inflation in 2021-2022 and started buying after the fact in order to protect themselves against another inflationary period in the future, causing the lagged relationship. If we extrapolate this trend into the future, the outlook for gold prices is not nearly as strong as the past couple years. Over the past 35 years, gold has produced an average annualized return of 6.6% (Bloomberg Gold Index), while global equities (MSCI All Country World Index) produced 8.9%.
Chasing rainbows
In recent months, meme coins have once again taken the cryptocurrency world by storm, with coins like “Official Trump,” “Official Melania,” “PEPE,” and others gaining massive popularity. Initially started as jokes, meme coins have seen a surge in value and interest, primarily driven by retail investors who are drawn in by the hype and viral nature of these tokens.
The appeal of meme coins lies in their accessibility, low entry price, and the potential for quick, massive returns. Social media and celebrity endorsements have only fueled the excitement, creating a frenzy of buying activity that can cause prices to skyrocket almost overnight. We’ve seen this story before. Back in early 2021, in the era of free money and zero interest rates, we saw meme coins such as “Dogecoin” and “Floki” take center stage, along with the NFT (non-fungible token) craze.
Unlike 2021, this cycle’s version of hysteria is even more driven by celebrity endorsements and has seen even swifter spikes and collapses in price. Below is a list of celebrities and government officials who have launched their own meme coins;
- Donald Trump
- Melania Trump
- Javier Milei (President of Argentina)
- Dave Portnoy
- Caitlyn Jenner
- Iggy Azalea
- Hailey Welch
This is just a short list of names that come to mind (we don’t want to take up a whole page here). Most of these tokens saw an initial spike in value within the first day or even hours, followed by a collapse in price. This is what some call “getting the rug pulled out from under you.” Not only is investing into these tokens worse than gambling in our opinion, but you may even get scammed as the waters are so muddied in what is a real celebrity endorsed coin on an official platform and what is not.
We strongly urge clients to avoid meme coins and not fall trapped to the viral nature of these crazes. Even the most “trustworthy” meme coin (emphasis on the quotation marks) was Official Trump, which was endorsed by Trump himself on Truth Social. This coin launched on 1/19/2025, peaked the next day at ~$75 per coin and now trades at $11 per coin as of 2/18/2025. Unless you got in from the beginning and out within 24 hours, you likely lost ~85% of your investment in just a couple of weeks. More recently, Argentina’s President, Javier Milei, has come under scrutiny for his meme coin which has also lost significant value overnight. Argentina’s stock markets sold off the next day due to a lack of confidence in leadership.
Peace talks in Riyadh
On February 18, officials from both the United States and Russia met in Riyadh, Saudi Arabia to discuss potential paths for an end to the Russia-Ukraine War. To the surprise of many European leaders, no delegates from any European nation (including Ukraine) were invited to this preliminary discussion. This is the first time officials from the U.S. and Russia have officially met since the war began three years ago. President Trump and Vladimir Putin did not attend this meeting.
These discussions likely included various topics such as
- Territorial adjustments: Potential redrawing of borders, possibly leading to the recognition of Russian-controlled territories in Ukraine.
- Security guarantees: Provision of security assurances to Ukraine, though the specifics remain uncertain.
- Economic cooperation: Exploration of economic and investment opportunities between the U.S. and Russia in the post-conflict period.
- Ukraine’s NATO status: Trump and Putin are likely to agree on this topic. Russia’s primary reasoning for sparking the conflict in 2022 was in response to the threat/possibility of Ukraine becoming a NATO nation which borders Russia. Two things can be true at once; 1.) Russia should not have invaded a sovereign nation 2.) Russia has been invaded on their western front multiple times in history, so their feeling of being threatened was real. From the U.S. perspective, the Trump administration has shown no interest in bringing in Ukraine as a NATO member.
After the fiery exchange between Trump, J.D. Vance, and Zelensky in the Oval Office, the details over a potential peace deal are still unclear. Following Zelensky’s visit to D.C., European leaders rallied together with new military spending plans and their own peace deal that would be presented to the U.S. and Trump. Europe’s plans include continued military aid to Ukraine as well as “boots on the ground and planes in the air,” to support Ukraine’s defenses. These plans are much more aggressive than what appeared to be discussed originally in Riyadh and it’s still unclear whether the U.S. would support these plans. It’s likely that the final deal will involve some concessions from both Europe and the U.S. in terms of military support going forward (finding some middle ground). Historically, whether it’s Ukrainian support or NATO spending, the U.S. has been the heavy lifter in tandem with Europe. There is speculation that Germany’s likely new chancellor, Friedrich Merz, has contemplated setting up special funding plans for defense and infrastructure in preparation for less U.S. support within the European region. On March 3, European stocks rallied ~1.5% in response to the slew of headline news.
This topic is evolving quickly in real time and it’s likely that our commentary above will be out of date by the time this article is posted.
With that said, what would an end to this conflict mean for the economies of European nations? For one, it would further boost sentiment/confidence in the region as a whole. Additionally, you may see some European nations resume trade with Russia who has mostly been cut off from the region. This would help to reduce supply chain bottlenecks and stabilize energy markets in Europe (and subsequently help to stabilize inflation further). Over the long run, portions of defense budgets could be reallocated towards more productive/innovative industries, and eventually, tourism may see a boost. These last two may take some time, but the door would be open.
Use of tax credits to fund private school
The Scholarship Donation Credit, also known as a tax-credit scholarship, allows taxpayers to receive full or partial tax credits when they donate to nonprofits that provide private school scholarships. These programs are designed to help families afford private school tuition without direct government funding. Instead, individuals and corporations donate to scholarship-granting organizations, which then provide scholarships to eligible students. The donors receive a state tax credit for their contributions.
As of now, close to two dozen states offer tax-credit scholarship programs. Here are some examples of states and the amounts they offer for the credit:
- Arizona offers a tax credit for donations to school tuition organizations, with a maximum credit of $766 for single filers and $1,527 for joint filers in 2025.
- Florida provides a tax credit for contributions to scholarship-funding organizations, with the credit amount equal to 100% of the donation.
- Georgia allows a tax credit for eligible businesses contributing to student scholarship organizations, with a maximum credit of $2,500 for single filers and $5,000 for joint filers.
- Pennsylvania offers a tax credit for contributions to scholarship organizations, with a maximum credit of 75% of the donation, which can increase to 90% if the donation is committed for two consecutive years. Students are eligible to receive a scholarship if their household’s annual income is no greater than $112,348 plus $19,775 for each dependent member of the household
- Ohio’s Scholarship Donation Credit allows individual taxpayers and pass-through entities to claim a credit for monetary donations made to eligible scholarship-granting organizations (SGOs). The credit equals the lesser of $750 or the total amount donated to SGOs during the tax year. If you are filing a joint return and both you and your spouse make eligible donations, each of you can claim this credit, up to a total of $1,500. To qualify for the credit, donations must be made directly to an eligible SGO, and the same contribution cannot be used to claim the credit in two tax years.
- Oklahoma has the most generous program offering tax credits of up to $7,500 directly to families whose children attend private school.
These programs vary by state in terms of eligibility requirements, the amount of the credit, and the types of expenses that can be covered by the scholarships.
Concerns have been raised on the success of these programs. It’s impossible to know for sure how many students on tax-credit scholarships are “switchers” from public schools and how many have been in private school the whole time and would have been even without the scholarship made possible. Arizona alone spent more than $1 billion between 2008 and 2019 on tax credits for donors to organizations that support private school scholarships, according to state data compiled by the advocacy group Public Funds Public Schools. By comparison, Arizona spends between $4 billion and $5 billion annually on public education.
If you need more detailed information about a specific state's program, feel free to ask!
Where will the stock market go next?
In the month of February, the S&P 500 Index fell 1.3%, bringing the year-to-date number to 1.4%. Small cap stocks (Russell 2000) and Mid cap stocks (Russell Mid Cap) lagged large caps during the month (-2.8% and -5.3%), bringing their respective year-to-date numbers to 1.3% and -2.9%.
Looking at the S&P 500’s performance for 2025, there has been a lot of choppiness/volatility, despite the slightly positive performance. As we’ve discussed in previous months, this was to be expected with the Trump 2.0 administration.
Most notably, international markets showed resilience in February, led by European and Chinese markets. Developed international markets (MSCI EAFE) were up 1% and emerging markets (MSCI EM) were up 0.8%, bringing their year-to-date returns to 5.8% and 2.4%, respectively. Chinese stocks rose by 11.6% while Europe rose by 3.1%
What is holding U.S. markets back? At the end of February, 470 of 503 companies within the S&P 500 reported their Q4 2024 earnings, with the average sales and earnings surprises being positive at 0.6% and 4.3%, respectively. Although, the average stock price reaction has been -0. 6%. Earnings are not falling apart, but the U.S. market continues to lag the rest of the world in 2025. In our view, U.S. markets have been “priced for perfection” after back-to-back years of strong gains, which primarily came from valuations expansion (discussed in the first section). Unless earnings expectations are “crushed,” these stocks are seeing limited upside reactions for the time being. From 2023 through 2024, the S&P 500’s P/E multiple increased by ~13% per year on average, well higher than the average for the past 15 years post-Global Financial Crisis (GFC).
In aggregate, from 12/31/2024 to 2/28/2025, the S&P 500’s earnings expectations for 2025 have dipped by ~1.3%. But still, on a year-over-year basis, earnings are expected to be up ~12%. We don’t believe that we’ll continue to see the valuation expansion (change in P/E) as experienced in 2023 and 2024 while sentiment continues to improve throughout the rest of the world.
Lastly, remember that investing in equities will be volatile, and reward does not come without risk. Since 1980, the S&P 500 has experienced an average annual “peak-to-valley” decline of ~14%. In 2023 and 2024, this decline was -10% and -8%, respectively. We don’t expect that type of low volatility environment to persist forever.
We are passionately devoted to our clients' families and portfolios. Contact us if you know somebody who would benefit from discovering the North Star difference, or if you just need a few minutes to talk. As a small business, our staff appreciates your continued trust and support.
Please continue to send in your questions and see if yours get featured in next month’s Timely Topics.
Best regards,


Mark Kangas, CFP®
CEO, Investment Advisor Representative