


Each month we ask clients to spend a few minutes reading through our newsletter with the goal of raising their investor IQ. March’s Timely Topics commentary discusses gold in context of market pullbacks and provides a great recipe for an edible pot of gold.
- Luck running out?
- Chasing rainbows
- Edible pot of gold
- Beware of cybercriminals
- NSAG News
- Where will the stock market go next?
Luck running out?
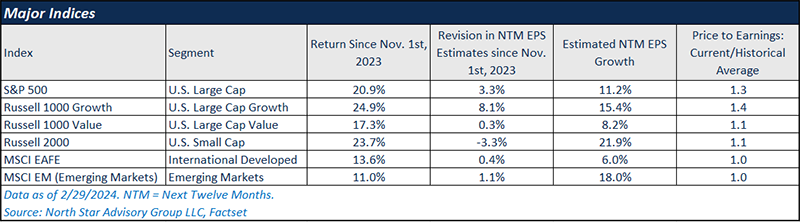
Since November 1st of 2023, the equity markets have experienced strong positive momentum. These strong returns have been felt broadly with U.S. Small Cap and large cap growth indices leading the way, +24% and +25%, respectively since 11/1/2023. When looking at each major index in aggregate, most EPS revisions for the next twelve-months have not matched the return experienced over the same time period. Long-term government bond rates (U.S. 10-Year Yield) have fallen by 0.5% since 11/1/2023, and this has partially driven the increase in valuations across the equity markets. Lower rates can provide a stronger tailwind for growth stocks and small cap stocks as the bulk of these companies’ cash flows tend to be forecasted further out over time.
Large cap growth stocks have had the largest upward revision in EPS estimates since 11/1/2023 (driven primarily by AI growth expectations), but there are other areas of the market that remain more attractive based on earnings growth and relative valuations. For example, U.S. small cap stocks and emerging market stocks currently trade at their historical valuation levels while having higher growth expectations relative to large cap growth. While there are many other factors that go into analyzing a segment of the market, these metrics serve as a good high-level starting point.
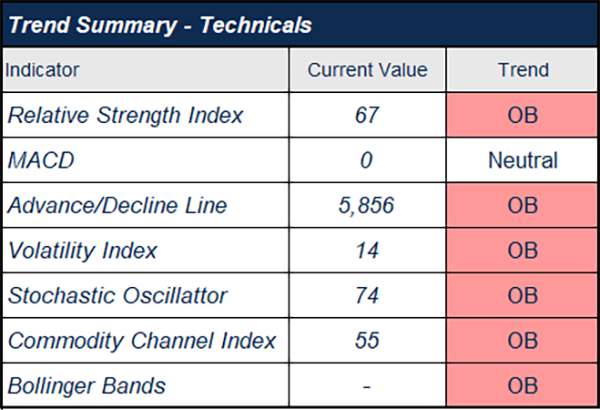
What does this mean in the short term? NSAG wouldn’t be surprised to see a small pullback in equities over the short term. Six out of seven popular technical indicators are flashing “overbought” for equities based on the S&P 500.
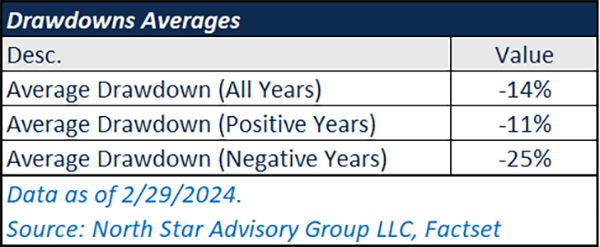
With the expectation that there could be some near-term downside volatility in equities, NSAG’s positive view on the broad markets has not changed. Over the past 40 years, the S&P 500 has experienced an average annual max drawdown of ~14% in each year when measuring a drawdown by the largest intra-year peak-to-trough fall. Despite these drawdowns, 32 of the past 40 calendar years still finished the year with positive returns. During those 32 years, average drawdowns were still ~11%. Furthermore, the average annual intra-year peak-to-trough fall is closer to 7-10% when you remove the large drawdown years like 2000, 2008 and 2020.
Chasing Rainbows
Market volatility has risen over the past two years relative to history. We’ve experienced various shocks to the global economy including record inflation, record paced rate hike cycles, a war in Europe, a war in the Middle East, a regional banking crisis, and much more. In 2024, we will also go through another election cycle (We wrote about investing through election years in February’s Timely Topics). With all these various factors that can be unpredictable, some investors can get nervous, lose sight of their long-term goals, and deviate from their risk tolerance. This can typically be seen when over-allocations are made to “safe haven assets” such as gold, treasury bonds, or cash with the goal of hedging exposure to equities. In the spirit of St. Patty’s Day, we will focus our attention on gold for this month.
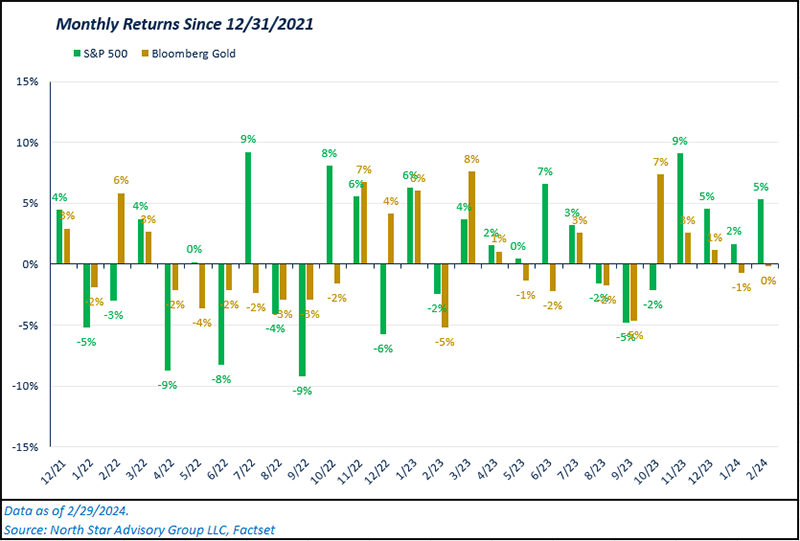
Gold has been viewed as an inflation hedge by popular culture for decades. Although, its correlation with CPI in many instances is not very strong (We wrote about this in March of 2022). Measuring the total return for both gold (Bloomberg Gold Index) and equities (S&P 500) since 12/31/2021 shows us that each asset has had approximately the same return since the start of 2022. If you examine the chart below, you’ll notice that gold did its job as a true “safe haven asset” one time (January – March 2022), outperforming equities by ~20% over that period. This delta of ~20% peaked on 3/11/2022 and equities have outperformed gold by ~23% since that day. Following March 2022, gold prices have generally followed all other pullbacks in the equity markets (Notably in Q1 and Q3 of 2023). Gold’s ability to mitigate downside risk has been spotty and inconsistent. Gold has only outperformed the S&P 500 in 10 out of 27 monthly periods since 12/31/2021.
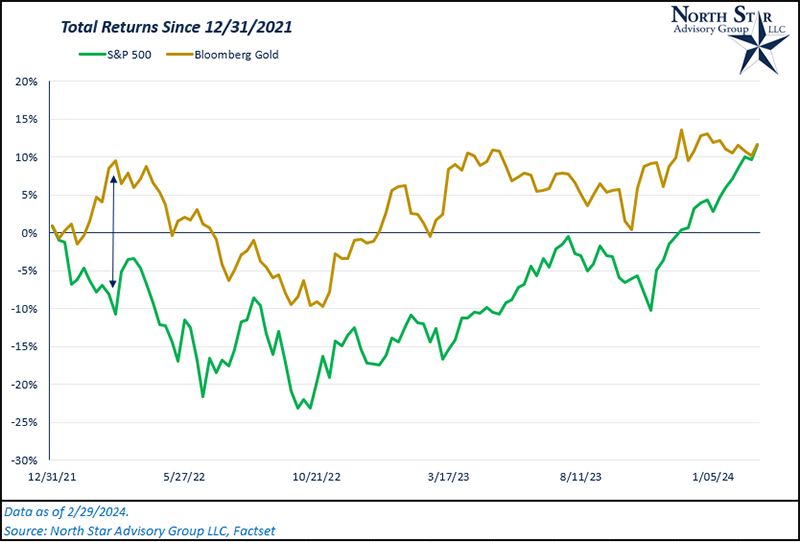
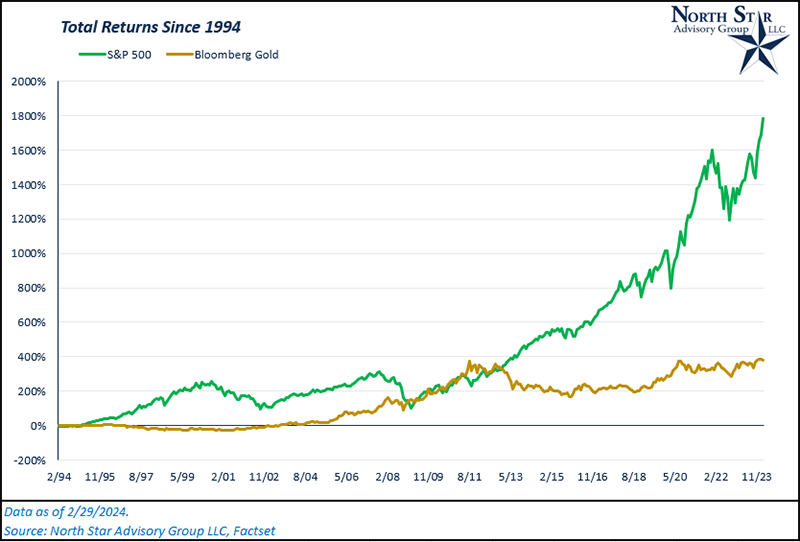
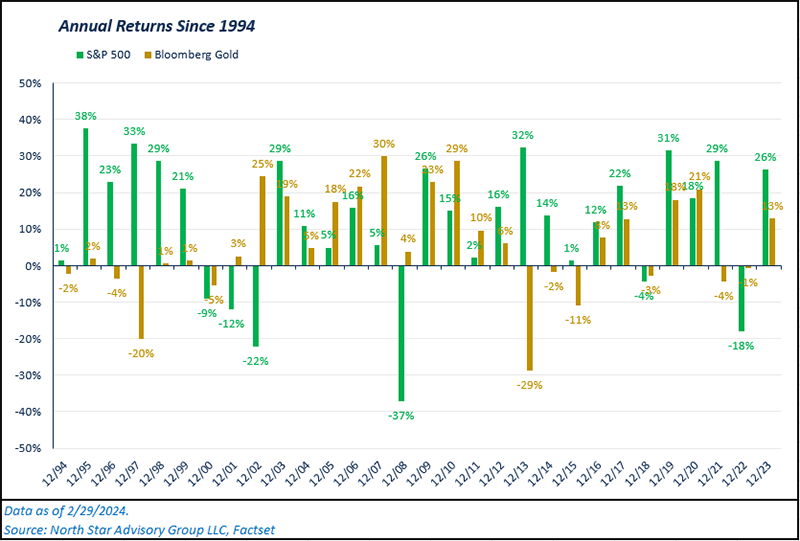
Zooming out and looking at gold over time, the asset has drastically underperformed equities. Given that we don’t encourage consistent efforts to time the market, we encourage clients to continue holding equities through future periods of market volatility. Missing out on quick reversals in a whipsawing equity environment can be detrimental to long-term portfolio returns. Gold has only outperformed the S&P 500 in 12 out of 30 annual periods since 1994.
Edible pot of gold
A popular St. Patrick’s Day staple is corned beef and cabbage – there are many recipes available online to make this classic meal in a crock pot if you want to get into the holiday spirit. Piggybacking off the crock pot idea, spend a few minutes this month looking for a new crock pot recipe or two. They can be a great time and money saver for meal prep. Pro tip – use a liner and you can make two meals at once and have a few options for weekly meals or lunches. It’s one more money and time saving tip in the kitchen.
Beware of cybercriminals
IMPORTANT ANNOUCEMENT…
Schwab, brokerage firms and banks are being targeted by cyber criminals with domains spoofing. Domain spoofing is when cybercriminals fake a website name or email domain to try to fool users. The goal of domain spoofing is to trick a user into interacting with a malicious email or a phishing website as if it were legitimate. During a phishing attack, an attempt will be made to steal personal information, such as account login credentials or credit card details, to trick the victim into sending money to the attacker, or to trick a user into downloading malware.
We have heard that some users are using Google to search for websites to log into. While searching, they inadvertently clicked on the spoofed link (which looks 99% like the correct website).
NSAG recommends that all clients:
- Bookmark the links to their financial institutions.
- Use www.nsag.com/resources/ to find the proper links to Schwab and other websites.
- Call NSAG if you question an email or website that you are visiting.
- Don’t download any application or program on your computer or phone. Schwab’s call center is not going to tell their clients they need to download a special program.
- Do not provide your username and/or password to anyone.
- Remember, that it is rare that NSAG’s clients actually talk directly to Schwab.
While we are on the topic and approaching tax season… Remember that the IRS does not call or email you. They will send you a letter. Anyone calling or emailing “from the IRS” is a cybercriminal.
NSAG News
After a little over a year with NSAG, Gage Paul is departing the firm to start a new RIA with another advisor. For about half of Gage’s time with NSAG, he’d been making a 160-minute round trip to Beachwood from New Philadelphia, where his wife Rose and family live. A lot has changed for Gage in the last 14 months since we all met him at NSAG’s annual holiday dinner at Pinstripes. We wish him the best of luck!
Where will the equity markets go next?
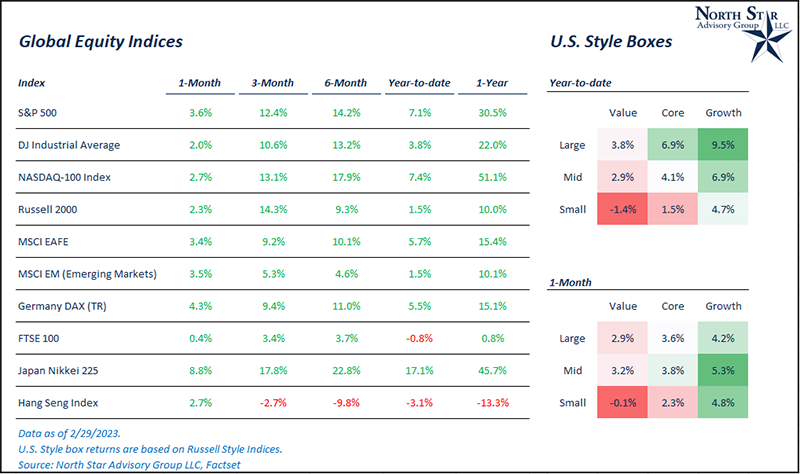
Through the end of February, we are seeing continued positive momentum in stock prices as the S&P 500 was up 3.6% in February (+7.1% for 2024). A continuation of 2023’s tech-led rally has been the broad theme across different segments of the market. Looking across the globe, Japan stocks continue to be one of the strongest performing markets with a 2024 YTD return of ~17% through just two months. As mentioned earlier in this month’s Timely Topic’s article, many technical indicators are flashing overbought signals for stocks, and we wouldn’t be surprised to see a mid-to-high single digit pullback at some point in the near term. Although, this does not alter our long-term view on stocks as we’ve continued to see several strong economic data readings (Low unemployment, improved sentiment, improved housing metrics, etc.).
With a strong economy typically comes stronger inflation. In February this same trend was felt as a couple inflation metrics came in slightly hotter than what was expected by the market. While this doesn’t change our opinion on the long-term downward direction of inflation, we saw an uptick in market interest rates which may put pressure on stocks in the near term. Federal funds futures now imply a near 0% probability of a rate cut during the Fed’s March meeting. (That probability was ~50% one month ago). The first rate cut is now not expected until June’s meeting. The path towards the Federal Reserve’s inflation target is not linear and a few upward (or downward) surprises should be expected.
We are passionately devoted to our clients' families and portfolios. Contact us if you know somebody who would benefit from discovering the North Star difference, or if you just need a few minutes to talk. As a small business, our staff appreciates your continued trust and support.
Please continue to send in your questions and see if yours get featured in next month’s Timely Topics.
Best regards,


Mark Kangas, CFP®
CEO, Investment Advisor Representative