


Each month we ask clients to spend a few minutes reading through our newsletter with the goal of raising their investor IQ. This month we focus on the struggle for freedom and commodity control taking place in Ukraine.
- Putin’s grab for Ukraine
- Gold
- Black Gold
- Fool’s gold
- NSAG News
- Where will the equity markets go next?
Putin’s grab for Ukraine
The morning of February 24, 2022, the phones started ringing and emails started pouring in. The markets opened down 2.6% with the DOW opening down 860 points and S&P 500 down 110 points. Russia’s invasion of Ukraine had clients asking if they should reposition their portfolios for safety. So how did we respond and what made the markets finish positive for the day?
It is important for investors to remember that not every volatile market move needs to be traded. After doing a quick assessment to confirm that the portfolio is properly diversified and the right investments are owned, it is ok to sit tight and wait out market dislocations.
The week prior to the invasion, global markets quickly priced in Russia’s takeover of Ukraine. It became clear quickly that politicians from all countries were not willing to send troops in for support, provide enough weapons for defense or work swiftly to financially hurt Russia prior to their invasion. After several days of fighting, many countries are trying to provide various types of support for Ukraine, but Russia’s military move will likely prove to be too strong for Ukraine to stop with a weak and quickly disabled army. Russia wants Ukraine’s commodities and does not want to pay Ukraine billions of dollars each year for Russia’s natural gas pipelines running through Ukraine. Russia is a huge player in various commodity markets and supplies 40% of the natural gas to Europe. This commodity alone will likely make it impossible to completely cut off Russia. Putin’s ambitions in Ukraine are not only focused on national security against NATO, but also include an eye on increasing his global control of commodity markets and their profit margins. The recent military actions have raised the prices of many commodities. Higher commodity prices have a negative impact on companies that produce and sell goods, many of which are value stocks. Therefore, value stocks had a smaller recovery on the day Russian tanks rolled into Ukraine.
For reference, the following are just a few of the key commodities that Russia controls as a large percentage of the global supply.
| Commodity | % of global exports |
| Grains/Oilseeds | 29% |
| Sunflower oil | 80% |
| Aluminum | 6% |
| Copper | 3.5% |
| Nickel | 7% |
| Palladium | 40% |
| Platinum | 10% |
| Gold | 10% |
| Titanium | 15% |
| Steel | 4% |
| Diamonds | 30% |
| Fertilizers | 13% |
| Oil | 13.7% |
Just a few days ago, the bond market changed from pricing in a 0.25% rate increase for March 2022 into a 0.50% increase in just one day! While this violently shot rates up higher, it showed the speed that markets can price in changing expectations. We have been writing about the impact of rising rates on stocks and growth stocks have been impacted the most in 2022 by the rising rate headwind. The invasion of Ukraine by Russia has now caused expectations for The Fed to reverse back to a 0.25% increase for March. This slower rate increase was an immediate injection back into growth stocks and ignited their recovery on what otherwise what would have been expected to be a bleak trading day. The prospects for slower rate hikes also acted as a weight on banking stocks, which are not as profitable with lower interest rates.
We also gained a glimpse at how strong the underlying economy remains. Early on in trading, airlines and travel stocks were still in positive territory. These pricing levels are clearly showing that consumers are still willing to travel and spend, in spite of Russia’s actions in Ukraine. In the long term, earnings will drive the market and we continue to expect companies to continue to beat expectations through the end of 2022.
Ironically, as clients inquired about reducing the risk in their portfolios, it is the riskier assets that posted the best returns of the day due to the potential of slower rate increases. Bank stocks were hurt by the potential of slower rate increases; manufacturing companies were hurt by the expectations of higher commodity prices. In the end… a client’s emotional reaction to sell or reduce risk would have been a bad decision on this day (and the following).
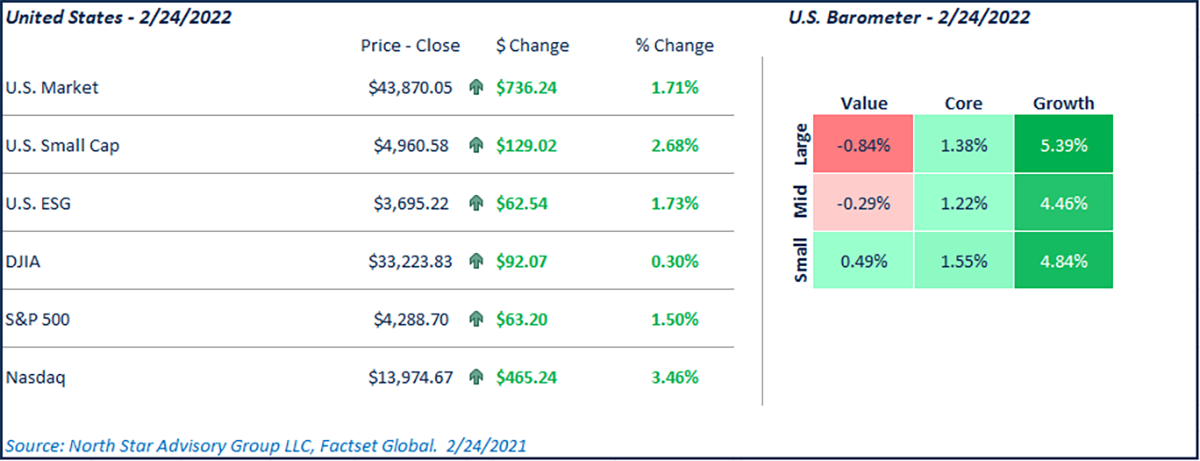
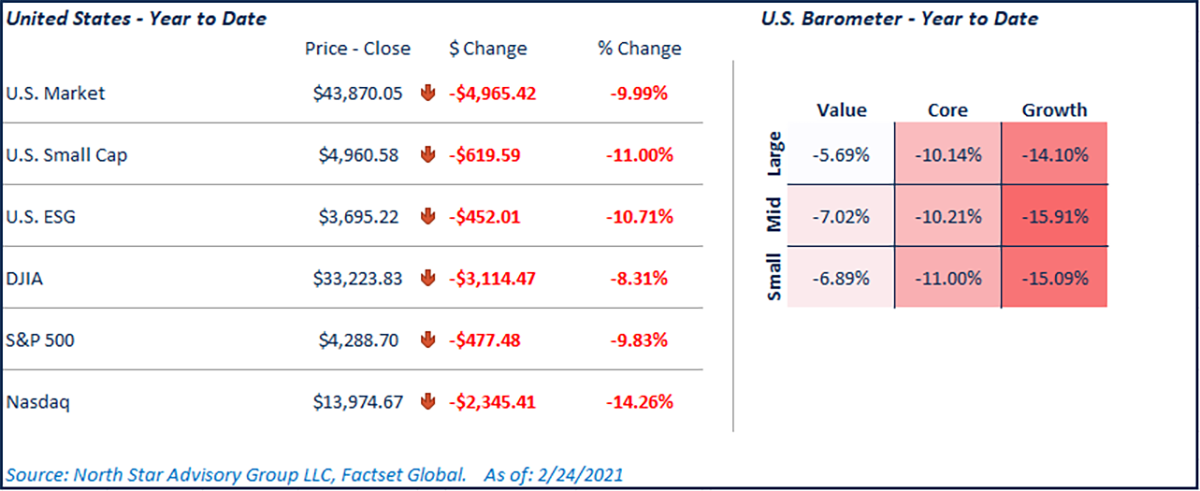
When the market closed, the DOW finished up 92 points or 0.28% and the S&P 500 finished up 63 points or 1.5%. The volatility and headlines from Ukraine are long from over. Therefore, investors need to be careful trading on fear and headlines. While one day is not indicative of the overall market, the trading that took place on this one day does provide a lot of education on what really moves the market (earnings and interest rates). The following chart breaks down the performance for various US markets and market caps on 2/24/2022.
Gold
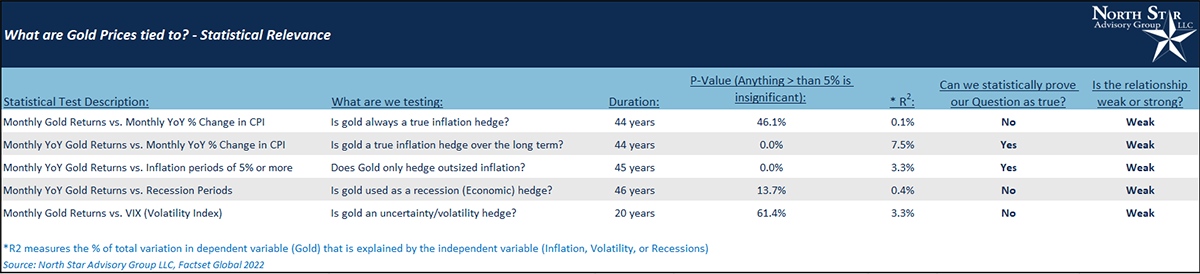
Is now the time to buy gold? Gold is often referenced when investors are looking to hedge inflation, recessions, or volatility. This month we took a look at the statistical relevance that gold provides in times of concern. The following table breaks down these 5 tests.
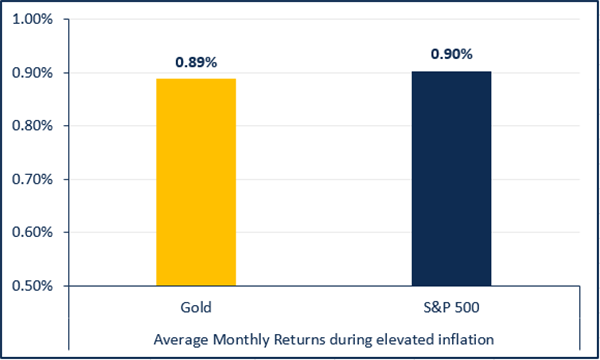
We dug past gold’s statistically weak relationship during times of high inflation to see how it has helped portfolio returns (the bottom line). Have gold’s return’s been better than the S&P 500 during periods of high inflation (CPI > 5%) or are equities a better hedge? In the following chart, we look over the last 45 years and measure the average returns during months where Core CPI was greater than 5%. Even during periods of high inflation, the S&P 500 still outpaced gold. Obviously, a lot more independent variables affect the prices of equities. That said, gold does not provide significantly better returns. Investors can’t entirely remove risks by purchasing gold, and there is additional risk of moving from the market to gold and not back in.
So, why do we buy gold? Are we buying it as a hedge against inflation, a growing asset, or a medium of exchange? Let’s walk through each scenario.
- Inflation hedge: If we refer to the Regression test summary table, we can see that only 2 of the 5 test scenarios show any statistical relationship between gold and inflation. In the first significant scenario (5% or more CPI), the strength of the relationship is very weak (R2 = 3.3%). Hypothetically, this means that if our model predicted a 2% return on gold, only 3.3% of that return value is caused by the change in inflation. For reference, a strong relationship should be an R2 value of 30% or more. The second significant scenario (Monthly YoY Gold returns vs. Monthly YoY CPI % change) is not economically significant. While there is a statistical relationship, an investor would have had to own gold 12 months prior to a high monthly inflation print to capitalize on any hedge attempts.
- Medium of Exchange: The U.S. began abandoning the gold standard in 1933 and abandoned completely in 1973.
- Growth: Gold has no revenue, earnings, TAM (Total Addressable Market for sales), or financial fundamental growth. The price of gold is still primarily driven by supply and demand, as it is a commodity. Gold has a perfectly elastic demand curve.
It is for all these reasons that long-term portfolios tend to perform better with low or no gold holdings.
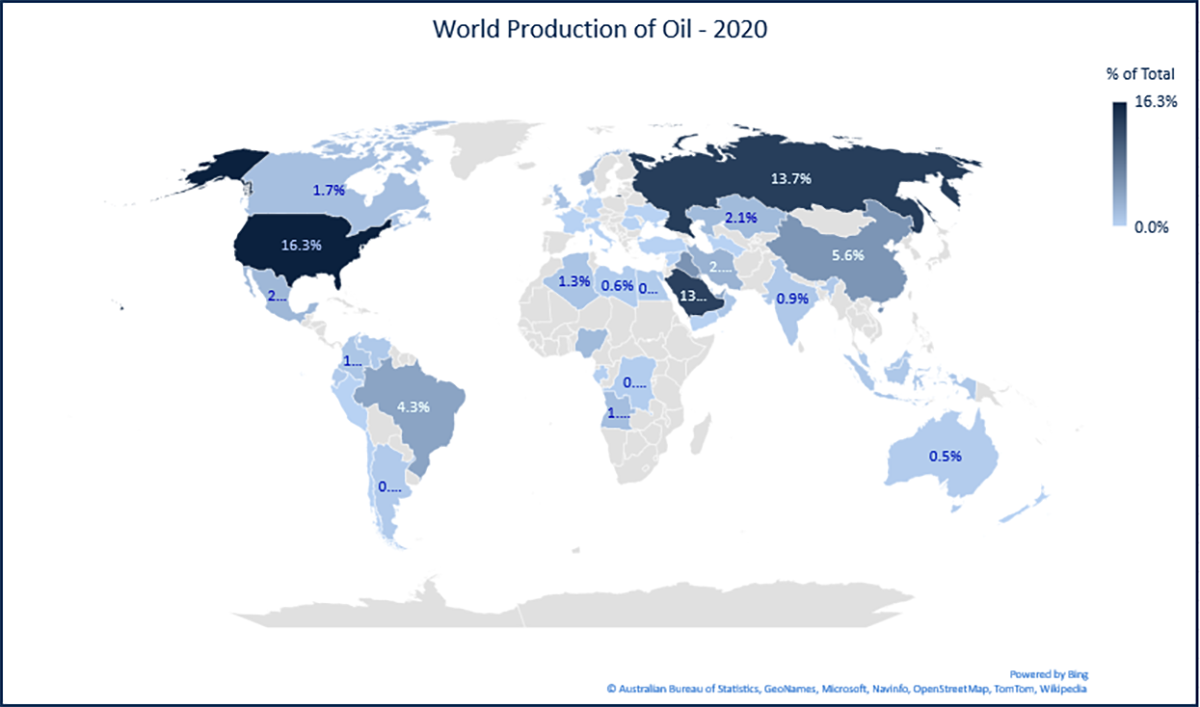
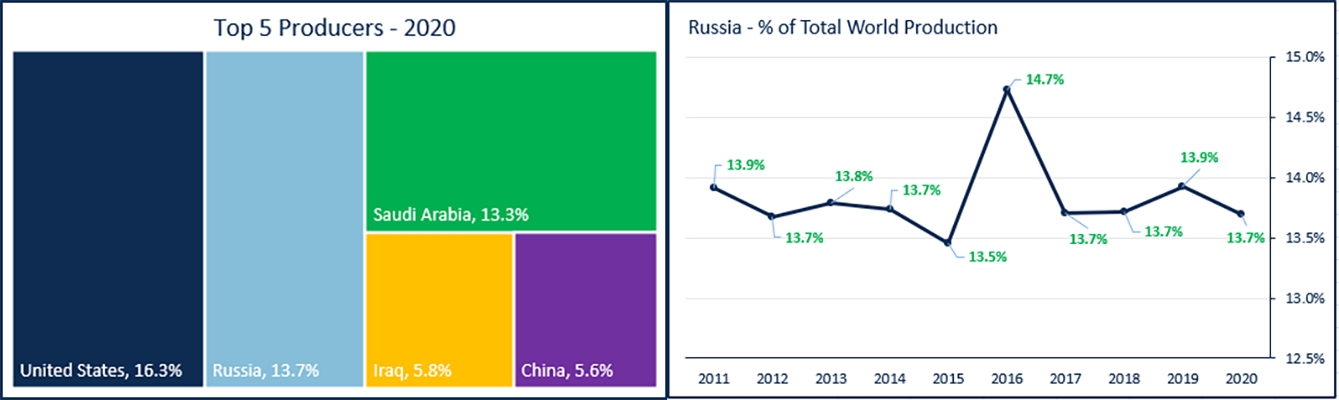
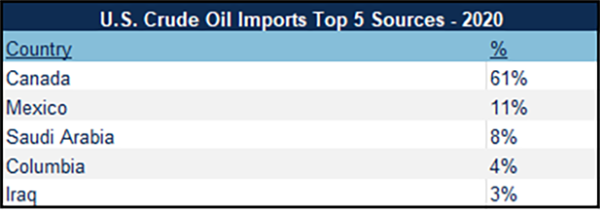
Black Gold
Black gold is at the center of the war with Ukraine. Russia sits as the 2nd largest producer of oil in the world and Ukraine is in Russia’s path of direct access for commodity distribution to Europe. Any existing pipelines going through Ukraine charge Russia a hefty toll. The top 5 producers represent 55% of world production and reduced access to Russia’s oil could lead to weaker negotiations with Iran.
Fool’s gold
While iron pyrite has a striking exterior resemblance to gold, when you look deeper into the quality of the mineral, it is not as rare or valuable as gold. It is for this exact reason why iron pyrite is often referred to as fool's gold. Any flashy but ultimately worthless investment may be called fool's gold in finance. So, how do you avoid being tricked into buying a worthless investment?
First of all, we need to understand that investing is not gambling. The risk/return ratio generally favors the stock market, which has a history of appreciating over the long term while gambling is mathematically designed to provide an edge to the house and the odds of losing increases the longer you play. This doesn't mean that a gambler will never hit the jackpot, and it also doesn't mean that a stock investor will always enjoy a positive return. It is simply that over time, if you keep playing, the odds will be in your favor as an investor and not in your favor as a gambler.
Managing the risk with short-term speculative investments is key. The late Vanguard founder Jack Bogle wrote in 2014 “Speculative investments will hurt you a lot, so I recommend you have a speculative account of no more than 5% of your portfolio. I also recommend that after five years, check it out. Has it done better than the long-term investment or worse? I’d be astonished if at least 95% of those speculative accounts don’t do worse.” No more than a 5% allocation could also mean a 0% allocation for some.
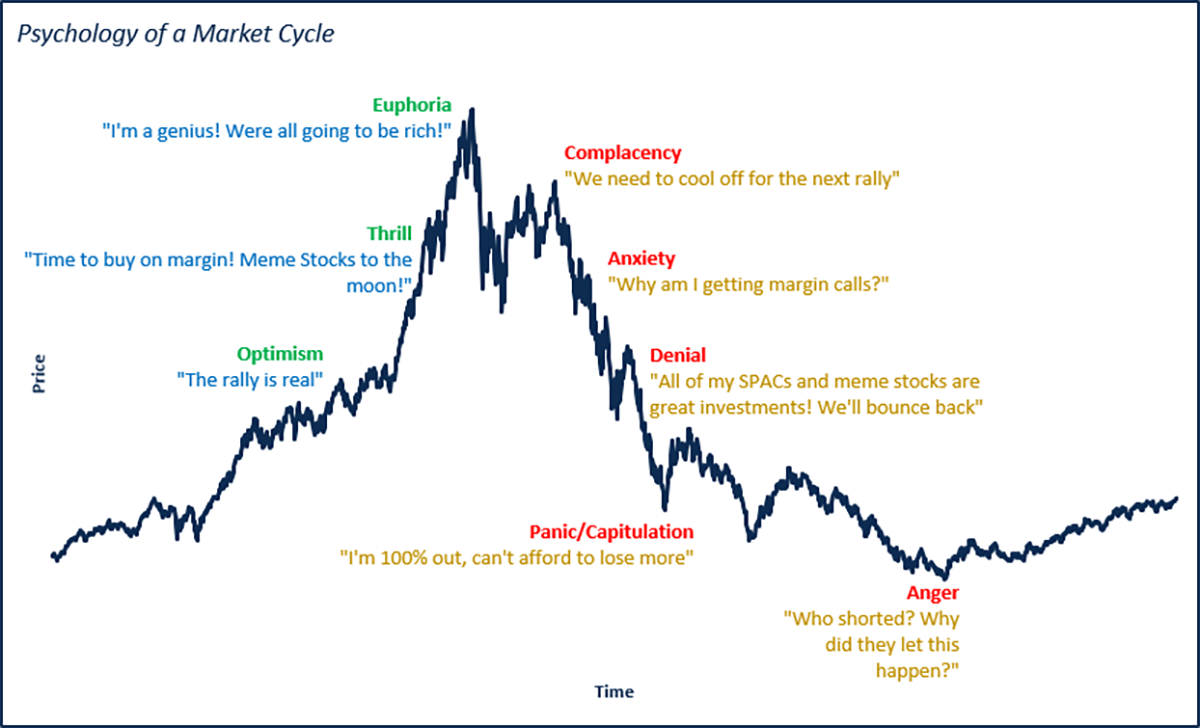
A period of free money from the government and “gamification” of investing has created a fear of missing out (FOMO) environment that underplays the risks involved and the danger of misinformation when it comes to investing. Additional fundamental research or support from North Star Advisory Group may help uncover the flashy new investment is nothing more than fool’s gold or a worthless investment.
For a little fun, let us know if you can guess the tickers of the blue and green returns chart! The first correct guess of BOTH tickers wins some NSAG swag.
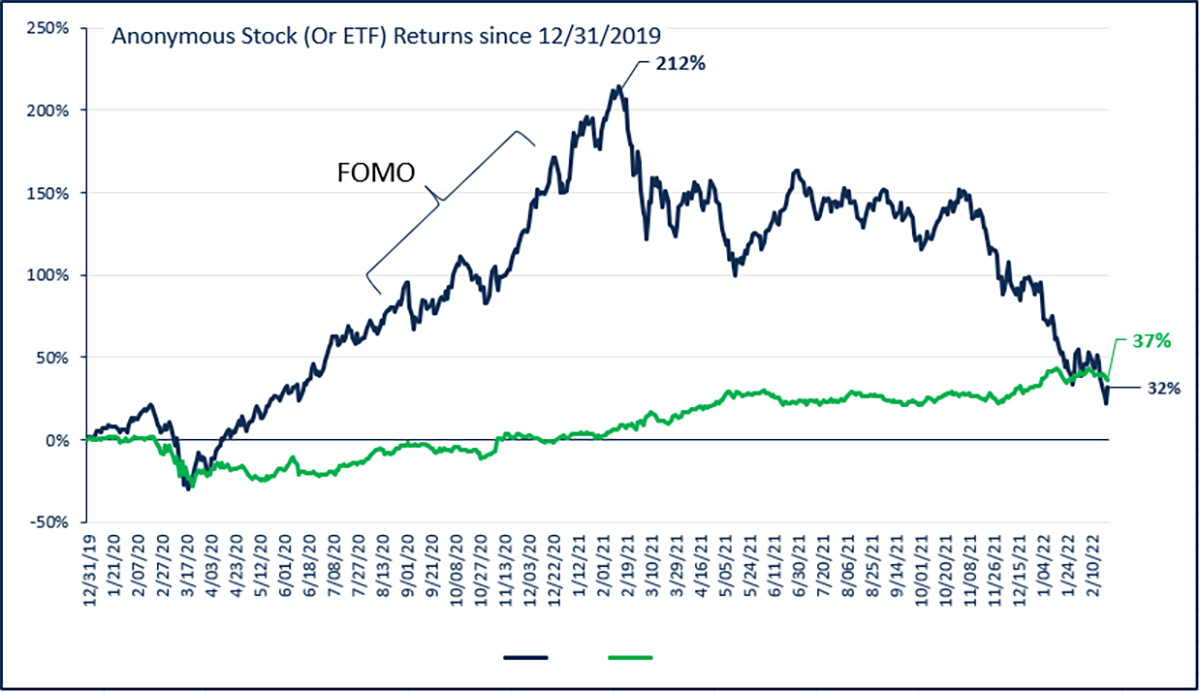
Since the beginning of November, we’ve seen many speculative stocks and other investments exhibit a similar chart pattern to the dark blue line in the above chart. Although not every large drawdown constitutes a “buying opportunity.” When looking at speculative investments, underlying business models, fundamentals, and future growth prospects will play the biggest role in determining if an investment is a great buying opportunity or poised to stay low for long. NSAG can help to filter through the weeds in the speculative space and manage volatility.
NSAG News
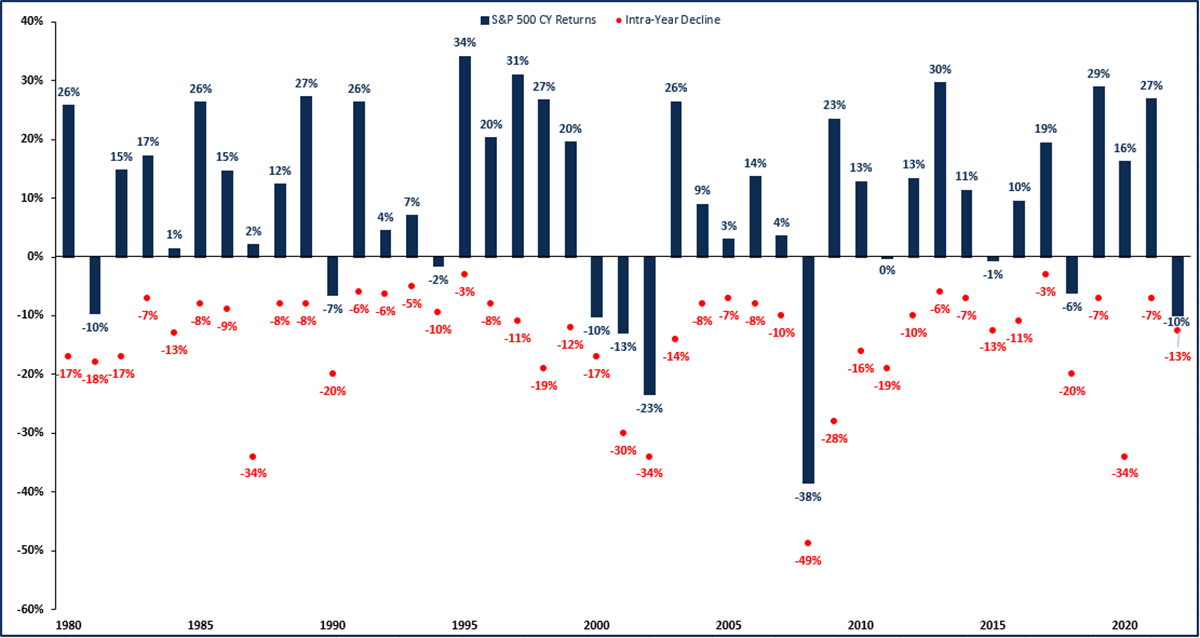
When we created Raising your investor IQ, the following slide was the first one included. We have used it for almost 20 years to help provide perspective on market movements. This chart still remains as relevant as ever, as 2022 has kicked off the year with a volatile first quarter. The dark blue bar charts reperesent the calender year’s total return on the S&P 500 for each of the past 41 years, including 2022’s year-to-date return. The red dots represent the worst case intra-year declines during each coincident calendar year. Over the last 41+ years, it is very normal to go through periods of volatility akin to what we are experiencing now. In fact, I often remind clients that it is on our “to-do list” for the market to experience a annual correction of 7-12%. Small corrects are part of a healthy market.
Where will the equity markets go next?
Before we look forward, lets recap where the year is so far.
While volatility appears to be the early trend in 2022, properly diversified portfolios have done a great job of weathering the storm. Uncertainty over the pace of interest rate hikes by The Federal Reserve has caused many investors to likely overreact and oversell. As of Mid-January, we are seeing the NASDAQ and S&P 500 being oversold. Oversold conditions could mean we are close to a near-term bottom if the specific oversold sectors of consumer services, consumer discretionary and/or technology can gain some traction.
We continue to see significant pullbacks focused in areas of speculation and those impacted the most by rising interest rates. The continued rotation from growth to value is likely to continue for at least the next year and is picking up steam as interest rates rise in connection with either COVID variants slowing down, rising inflation or both.
Even with the risk of Ukraine and rising sanctions, there continues to be virtually zero risk of a double-dip recession. As noted above, the Federal Reserve is prepared to speed up or slow down rate hikes when necessary. As a reminder, a recession is approximately six months of negative GDP. Even with The Fed raising rates, virtually no economists are forecasting negative GDP figures resulting in a recession. Less growth does not equal a recession. We still believe we are in a secular bull market, which started in 2010 and typically lasts around 15-20 years. However, this secular market is likely to last longer due to a slow start in 2010-2013.
We are passionately devoted to our clients' families and portfolios. Let us know if you know somebody who would benefit from discovering the North Star difference, or if you just need a few minutes to talk. As a small business, our staff appreciates your continued trust and support.
Please continue to send in your questions and see if yours gets featured in next month’s Timely Topics.
Best regards,


Mark Kangas, CFP®
CEO, Investment Advisor Representative