
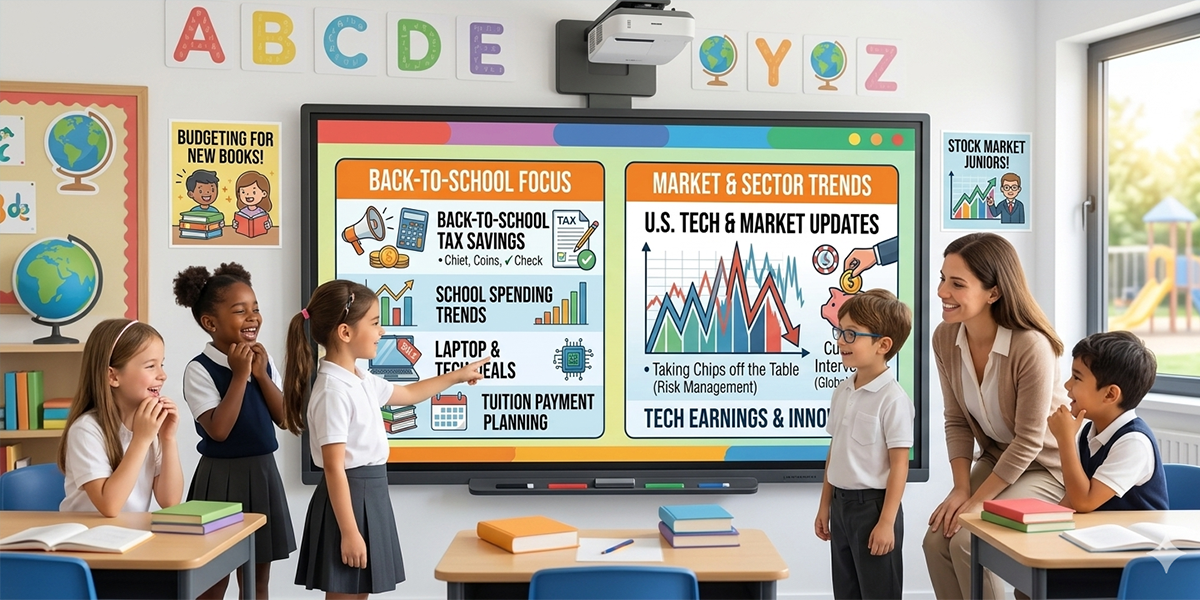
Each month, we invite clients to spend a few minutes reading our newsletter to build their investor IQ. August’s edition of Timely Topics focuses on recent consumer trends through the “back to school” lens and touches on recent volatility within the U.S. technology sector. Additionally, we congratulate Nick, Matt, and Riley on earning major career milestones.
- Taking chips off the table
- Currency intervention
- Back to school tax savings
- School spending trends
- NSAG News
- Where will the stock market go next?
Taking chips off the table
Throughout 2026, the broader market has continued to orbit around shifting narratives related to AI and the infrastructure investment associated with scaling the new technology. As a broader theme, AI technology started off the year with positive developments surrounding agentic AI capabilities, and in particular, the usefulness of new tools like Claude Code and Codex (OpenAI’s coding agent). As the capabilities of these tools became more mainstream, enterprise adoption of AI began to explode, and usage has been on the rise. While AI adoption has been growing robustly since 2022, the rise of agentic AI capabilities have put AI adoption on an even larger S curve then it had previously been one. From 1/1/2026 through 7/28/2026, daily “token” usage has grown from ~600 billion to 5.5 trillion, almost a 10x increase according to OpenRouter.
As a point of reference, an AI “token” is the smallest unit of text that an AI language model processes, and token counts are the standard way of measuring AI usage, costs, and processing volume.
AI usage growing 10x in just ~7 months is the textbook definition of exponential growth, and this exponential growth has been running into a supply chain that has linear capacity. Whether we are talking about GPUs, CPUs, or memory chips, the manufacturing capacity needed to produce this hardware and balance supply/demand dynamics does not appear overnight. For this reason, semiconductor companies (memory in particular) have been pushing pricing increases onto to their customers and earnings expectations for 2026 and 2027 have grown by 48% and 68%, respectively since the beginning of the year. The stock prices of these various companies have grown alongside this step up in earnings expectations. As of 6/22/2026, the PHLX Semiconductor Index was positive by ~115% on a year-to-date basis, but has since declined by ~23% through the end of July. The 23% decline has come in-spite of a continued increase in earnings expectations.
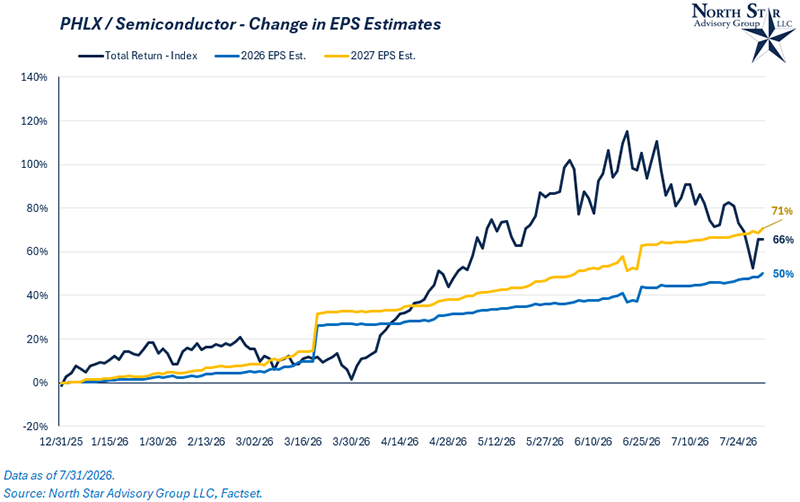
While AI demand doesn’t appear to be slowing down and earnings expectations continue to rise, why has the drawdown in semiconductor stocks occurred so quickly and violently? In our view, the decline has come mostly from technical factors. Many hedge funds and institutions had some of their largest exposures to these types of names on record heading into June, many new leveraged ETF products tracking individual semiconductor stocks have hit the marketplace, and retail investors had been piling into these names hoping they would only go higher. This is textbook speculative and momentum chasing which left the sector very crowded. A lot of the decline in recent weeks is simply due to the fact that there weren’t a lot of buyers left in this part of the market and investors began taking profits on their winning names.
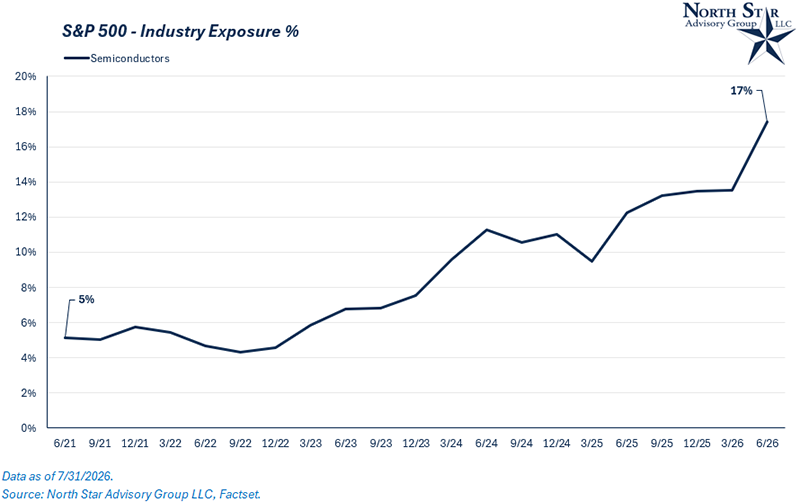
For the most part, the underlying fundamental story remains intact. Some investors and news outlets have pointed to the recent rise of lower-cost, Chinese, open-source AI models and the sustainability of hyperscaler capital expenditures as potential headwinds. In our view, however, cheaper AI models are more likely to accelerate adoption, leading to an even steeper demand curve and further increases in computing power requirements.
That said, the hyperscalers are projected to spend roughly 100% of their operating cash flow on capital expenditures over the coming quarters. As a result, companies such as Google and Amazon have increasingly tapped into the debt and equity markets to help fund these investments, which lies at the heart of the sustainability debate. Ultimately, as long as these companies continue to demonstrate attractive returns on their AI investments, we believe this concern will gradually fade. For now, however, it remains the most credible critique of the AI investment thesis in our view.
Currency intervention
On the final day of July, the U.S. and Japan coordinated an intervention in the foreign exchange market following a prolonged period of weakness in the Japanese yen. The objective of the intervention was to stabilize currency markets and slow the pace of the yen's decline, which had contributed to rising import costs and inflationary pressures in Japan. While currency interventions are relatively uncommon, coordinated action between the United States and Japan is even rarer and drew significant attention from global investors.
The U.S. dollar and Japanese yen form one of the world's most important currency pairs, making movements in the exchange rate relevant far beyond the two countries involved. Japan is one of the largest sources of global capital and a major holder of U.S. Treasury securities, meaning changes in the yen can influence global bond yields, capital flows, and investor risk appetite. The currency pair also plays a central role in the yen carry trade, where investors borrow at Japan's relatively low interest rates to invest in higher-yielding assets elsewhere. When the yen strengthens rapidly, these positions can unwind, creating volatility across global equity and fixed income markets. We last saw an unwind of this carry trade almost two years ago to the day. You can read more about that in our September 2024 addition of Timely Topics.
For investors, this currency pair should be monitored closely in the coming weeks.
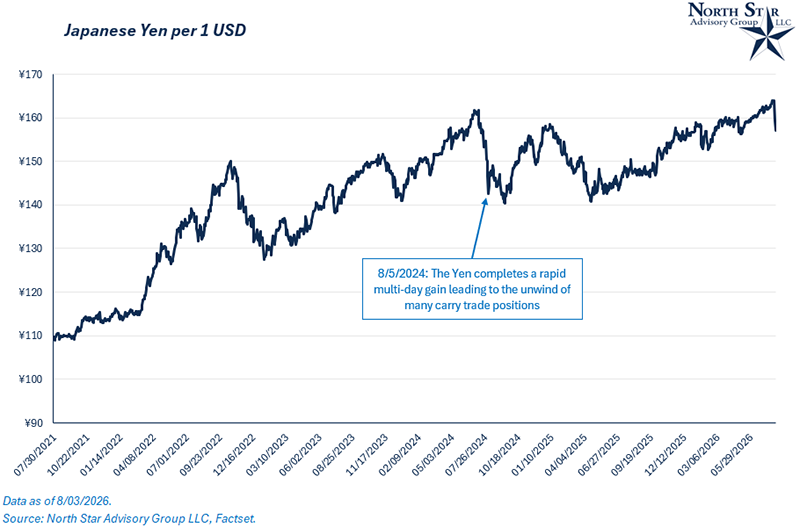
History suggests that coordinated currency interventions tend to occur only during periods of significant market stress or when exchange-rate movements are viewed as disorderly. Notable examples include the Plaza Accord of the 1980s, which sought to weaken the U.S. dollar, as well as several interventions following periods of financial instability in later decades. While intervention can influence exchange rates over the short term, long-term currency trends are ultimately driven by economic fundamentals, interest-rate differentials, and monetary policy. As a result, investors will likely remain focused on central bank policy and economic data to determine whether recent currency movements represent a temporary adjustment or the beginning of a more lasting shift.
Back to school tax savings
The Ohio 2026 back-to-school sales tax holiday will take place from August 7th to August 9th. There are a few stark differences when comparing the 2026 holiday to previous years. In 2025, the tax holiday lasted from August 1st to August 14th and applied to a broader range of qualifying purchases including restaurants and purchases under $500. Most of the exclusions in 2025 were for services, motor vehicles, some forms of watercraft, age-restricted consumable exclusions such as alcohol, tobacco, vaping products, and marijuana products, and purchases above $500.
For 2026, however, the tax holiday in Ohio is more limited and applies only to clothing, school supplies, and school instructional materials. This change came due to Ohio House Bill 186, which redirected funding from the expanded sales tax holiday toward property tax relief efforts. The legislation was designed to help limit growth in certain school district property taxes and provide financial relief to homeowners facing rising property tax bills. To fall under the exemption now, shoppers must purchase clothing priced at $75 or less per item, school supplies priced at $20 or less per item, and school instructional materials priced at $20 or less per item.
Clothing refers to all types of apparel that people wear for general use. This includes a wide range of items such as everyday garments, footwear, accessories, specialty items (like uniforms, formalwear, and athletic gear), and products for different age groups, including infants and adults.
School supplies are items typically used by students for learning and coursework. This includes essentials like writing tools, paper products, organizational items, classroom tools, as well as materials such as calculators, art supplies, and lunch boxes. School instructional materials are written resources that students use to learn and reference course content. These include textbooks, workbooks, reference books, maps, and globes.
When multiple items are sold in a single transaction, each item is considered separately to determine eligibility. For example, if a customer purchases six qualifying clothing items, with each item costing $70 for a total of $420, the entire amount would be exempt from sales tax as every item is priced at $75 or less. Additionally, items that are typically sold together must remain bundled during the sales tax holiday and can’t be divided into separate parts for exemption qualification.
If an eligible item purchased during the tax holiday is later exchanged for the same item, no sales tax will be charged, even if the exchange takes place after the holiday period has ended. However, if the item is returned and the credit is applied to a different item after the holiday, sales tax will then be charged on the new item.
If a discount lowers the price of an item below the appropriate qualifying threshold, the item will qualify for the sales tax exemption. This rule applies to all types of discounts, including coupons and loyalty card savings.
Sales tax holidays are not unique to Ohio. In fact, 18 other states offer a sales tax holiday between August and the end of the calendar year, including Arkansas, Connecticut, Florida, Illinois, Iowa, Louisiana, Maryland, Massachusetts, Mississippi, Missouri, Nevada, New Mexico, Oklahoma, South Carolina, Tennessee, Texas, Virginia, and West Virginia. For detailed information on qualifying items, exemption limits, and specific holiday periods, taxpayers can consult each state’s official government website.
While each state establishes its own rules regarding eligible purchases, spending limits, and holiday dates, Ohio’s 2026 sales tax holiday is generally more restrictive than many of its counterparts, as it is focused primarily on school-related purchases. In contrast, five states do not charge sales tax at a state-wide level, making the idea of a sales tax holiday obsolete. These states are Alaska, Delaware, Montana, New Hampshire, and Oregon.
School spending trends
At first glance, the 2026 back-to-school season looks relatively healthy. National Retail Federation (NRF) data shows average household spending rising slightly from $858 in 2025 to $864 in 2026, a gain of just 0.7%. On the surface, this suggests spending remains stable despite ongoing economic uncertainty. However, consumer confidence remains under pressure by inflation, labor market concerns, trade-policy uncertainty, and geopolitical tensions in the Middle East. As a result, spending growth is less than 1%, which is modest by historical standards. This indicates that households are carefully managing budgets rather than expanding discretionary purchases.
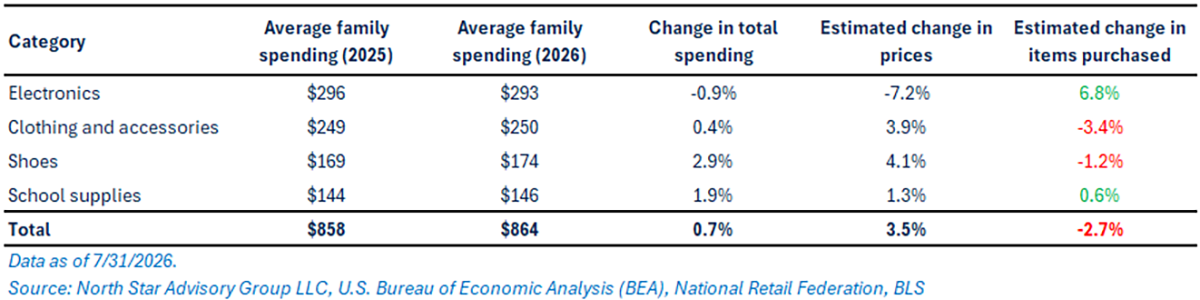
The chart reveals why yearly spending can be misleading. Using Bureau of Labor Statistics (BLS) price data, overall, back-to-school prices are estimated to have increased by approximately 3.5% year over year. When spending growth is adjusted for inflation, households appear to be purchasing about 2.7% fewer items overall. In other words, families are spending roughly the same amount of money but receiving less in return. This reflects a broader consumer environment where inflation remains elevated enough to erode purchasing power, even when household spending appears resilient.
The category breakdown highlights an increasingly selective consumer. Electronics stand out as the strongest category, with spending declining slightly but prices falling significantly due to ongoing technology deflation. After adjusting for lower prices, electronics volume appears to be up nearly 7%, suggesting families continue to prioritize technology purchases for education and productivity. In contrast, apparel and footwear show the opposite pattern. Clothing and shoe prices have risen faster than spending, implying fewer units purchased and potentially more value-seeking behavior. School supplies remain relatively stable, demonstrating that families continue to prioritize core educational necessities even as budgets tighten.
This consumer behavior is consistent with broader economic trends reported by the Bureau of Economic Analysis (BEA). Recent Personal Consumption Expenditures (PCE) data shows that nominal consumer spending continues to grow faster than real, inflation-adjusted spending. June saw a slight decline in prices as the MoU between the U.S. and Iran had temporarily eased oil and energy prices.
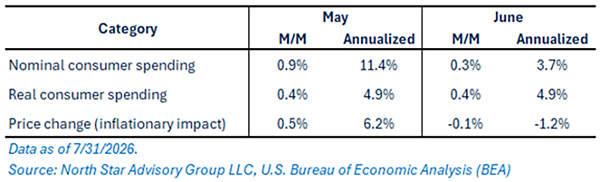
Consumers are still spending, especially on necessities, but they are becoming more careful about how and where they spend. The back-to-school season reflects a broader trend: households continue to make purchases, but they are increasingly focused on finding value and managing costs.
From a retail and market perspective, this year's back-to-school season suggests that demand is not collapsing, but it is becoming more dependent on value, promotions, and category-specific pricing dynamics. Retailers positioned in technology and value-oriented merchandise may outperform because consumers are actively seeking areas where prices are falling or where perceived utility is high. Meanwhile, categories facing persistent inflation, such as apparel and footwear, may experience weaker volume growth even if dollar sales remain stable. The key lesson for investors and retailers is that headline spending numbers alone are no longer enough the real story lies in understanding the difference between nominal spending and actual units purchased. For example, NRF expects total back-to-school spending to reach a record $43.3 billion, up from $39.4 billion in 2025, suggesting demand remains stable. Yet consumers are becoming more deliberate in how they spend. Nearly 46% of shoppers are waiting for the best deals, while 23% are spreading purchases over time to manage their budgets. This indicates that spending growth is being driven more by necessity than confidence, as households continue to prioritize value and affordability.
NSAG News

We are very pleased to announce that Nick Stern passed the July 2026 Certified Financial Planner™ (CFP®) exam.
Nick is now pending approval of his application to become a CFP® certificate holder, which will be achieved after completing the required hours of work experience needed (February 2027).
More about the CFP designation:
The CFP® certification is the standard of excellence in financial planning. CFP® certification includes testing on cash flow planning, insurance planning, retirement planning, tax planning, investment planning, and estate planning. CFP® professionals meet rigorous education, training and ethical standards, and are committed to serving their clients' best interests today to prepare them for a more secure tomorrow.


Additionally, we want to extend congratulations to both Matt and Riley on passing their Financial Paraplanner Qualified Professional (FPQP™) exam. This comprehensive program covers the fundamentals of financial planning, including retirement planning, insurance, estate planning, tax considerations, and many other core areas of the profession. This is Matt and Riley’s first step in a multi-year career-education partnership between Bowling Green State University and NSAG.
The continued success of NSAG’s practice and our employees’ passing rate of certifications is a huge credit to the dedication we bring to each and every one of our clients. Cheers Nick, Matt, and Riley!
Where will the stock market go next?
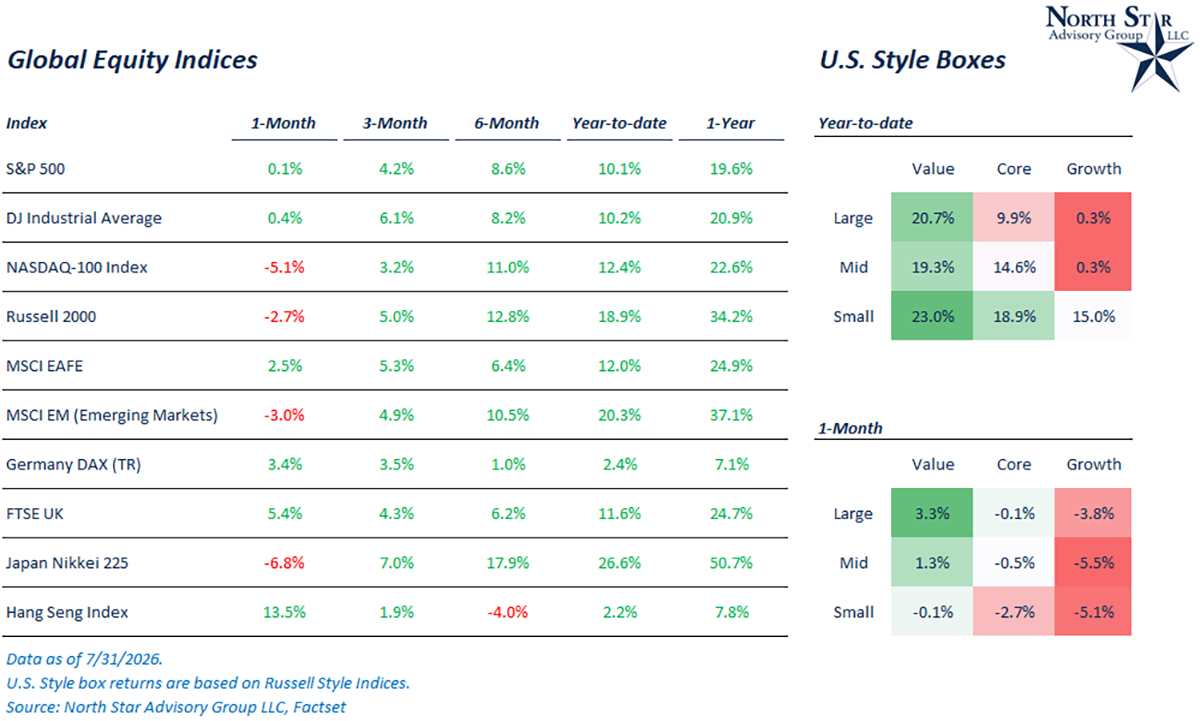
July’s market movements can be characterized in short by shifting AI sentiment and technicals. In late June, many investors had become overly concentrated in the semiconductor and semi-cap equipment sectors. After all, this is the sector that has defined the majority of 2026’s stock market returns so far, and momentum chasing is very common during technology driven investment cycles. July saw the Nasdaq 100 Index fall 5.1% and the PHLX Semiconductor Index fall 15.3%. While there are some fundamental critiques over the sustainability of this cycle and the AI-capex spending theme, most of the selling in July was driven by profit taking and institutional de-leveraging. Notably, a $45 billion AI focused hedge fund had its public equity assets fully liquidated due to leverage. With all that said, the Nasdaq 100 index has still gained 12.4% for 2026 as of 7/31/2026.
Conversely, quality value stocks posted gains during the month as investors rotated into stocks whose growth isn’t directly tied to hyperscaler capital expenditures. The Russell 1000 Value index rose by 3.3% in July. The MSCI EAFE Index (developed international) also rose by 2.5% in July. Both of these indices have smaller weightings to AI capex beneficiaries and are more defined by value sectors such as financials, energy, and industrials.
We are passionately devoted to our clients' families and portfolios. Contact us if you know somebody who would benefit from discovering the North Star difference, or if you just need a few minutes to talk. As a small business, our staff appreciates your continued trust and support.
Keep sending your questions for a chance to be featured in next month’s Timely Topics.
Best regards,

Mark Kangas, CFP®
CEO, Investment Advisor Representative


Brian Duffield, CFA®
Co-Portfolio Manager & Market Strategist