


Each month we ask clients to spend a few minutes reading through our newsletter with the goal of raising their investor IQ. Heading into the back half of summer, we are focusing September’s Timely Topics on Medicare, the mechanics of carry trades, and how to navigate an environment with increasing rate volatility.
- Medicare changes
- What happened on August 5?
- Other potential carry trades
- Yields (CDs, MM, Corps, Munis, etc.)
- NSAG News
- Where will the stock market go next?
Medicare Changes
January 1, 2025, brings one of the largest changes ever seen to Medicare. While the changes aim to improve affordability and access to medications for Medicare enrollees, premium increases are expected while some providers change or drop existing plans. We expect a large number of current enrollees to have questions and need assistance. If you or a loved one needs to talk to a professional, NSAG has resources to assist. The following are a few of the key changes that will take place.
The Inflation Reduction Act of 2022 is driving the changes to Medicare Part D plans for 2025 by:
- Capping Out-of-Pocket Spending: Starting in 2025, there will be a new $2,000 annual cap on out-of-pocket prescription costs for Medicare beneficiaries. This means that once you reach this limit, your out-of-pocket expenses for covered medications will be capped.
- Elimination of Coverage Gap Phase: The coverage gap (also known as the “donut hole”) in Medicare Part D will be eliminated in 2025. Previously, beneficiaries faced higher costs during this phase, but now they’ll have continuous coverage throughout the year.
- Changes in Drug Costs: Medicare Part D plans will pay a higher share of drug costs during the catastrophic phase. Additionally, there will be adjustments to plan costs and the manufacturer price discount in the initial coverage phase.
Medicare will introduce several additional changes aimed at enhancing healthcare access and affordability for beneficiaries. Here are the key updates:
- Crackdown on Sales Incentives: Medicare will end sales incentives for agents and brokers who sell three types of Medicare policies—Medicare Advantage plans, Medigap (Medicare supplemental) plans, and Part D prescription drug plans. This change aims to protect seniors from deceptive marketing practices and ensure that agents recommend plans based on beneficiaries’ needs rather than financial incentives.
- Compensation Caps: The new rule will limit compensation for brokers and agents.
- Unused Supplemental Benefits Notification: Starting in 2025, Medicare Advantage plans will send policyholders personalized “Mid-Year Enrollee Notification of Unused Supplemental Benefits” each July. This notification will help beneficiaries understand and utilize their plan’s supplemental benefits.
While the changes are aimed to make Medicare more affordable to consumers, reducing and/or eliminating compensation may have a negative effect: causing highly skilled and knowledgeable agents to exit the market. This would adversely affect consumer’s already challenging position to find a skilled agent to explain the ins and outs of Medicare to them so they can make the best healthcare insurance decisions for themselves and their loved ones.
Keep in mind that while these changes aim to benefit most Medicare recipients, individual circumstances may vary. If you have specific concerns, it’s advisable to consult with a Medicare expert or your healthcare provider
What happened on August 5?
As many became overnight experts on the Japan carry trade following the global market selloff of August 5, we thought now would be a good time to walk through the basic mechanics of this trade and what allows it to be successful.
Carry trades are fairly simple from an operational standpoint. An investor borrows currency with low interest rates, converts that borrowed currency into a higher yielding currency and invests the proceeds to earn the higher yield. Assuming no change in exchange rates, the investor would profit from the interest rate differential. Historically, carry trades typically offer low but consistent positive returns with a low number of larger outsized losses. To minimize the number of large losses, investors typically opt for currencies that have low volatility, so these trades rarely take place with a non-developed nation’s currency.
The most popular carry trade in the past couple years has been borrowing Japanese Yen and converting to U.S. dollars. The average difference between the U.S. 10-year government yield and Japan’s 10-year government yield has been ~3.4% over the past two years. On top of this spread, the Japanese Yen has weakened versus the U.S. dollar, adding to the returns from this trade (When you borrow a currency, you are effectively shorting that currency). Lastly, many investors involved in this trade didn’t just invest the proceeds into U.S. government bonds, they opted to invest proceeds into U.S. technology stocks. Doing this greatly increased the trade’s risk while also increasing the return on both ends. So, what is causing this to unwind?
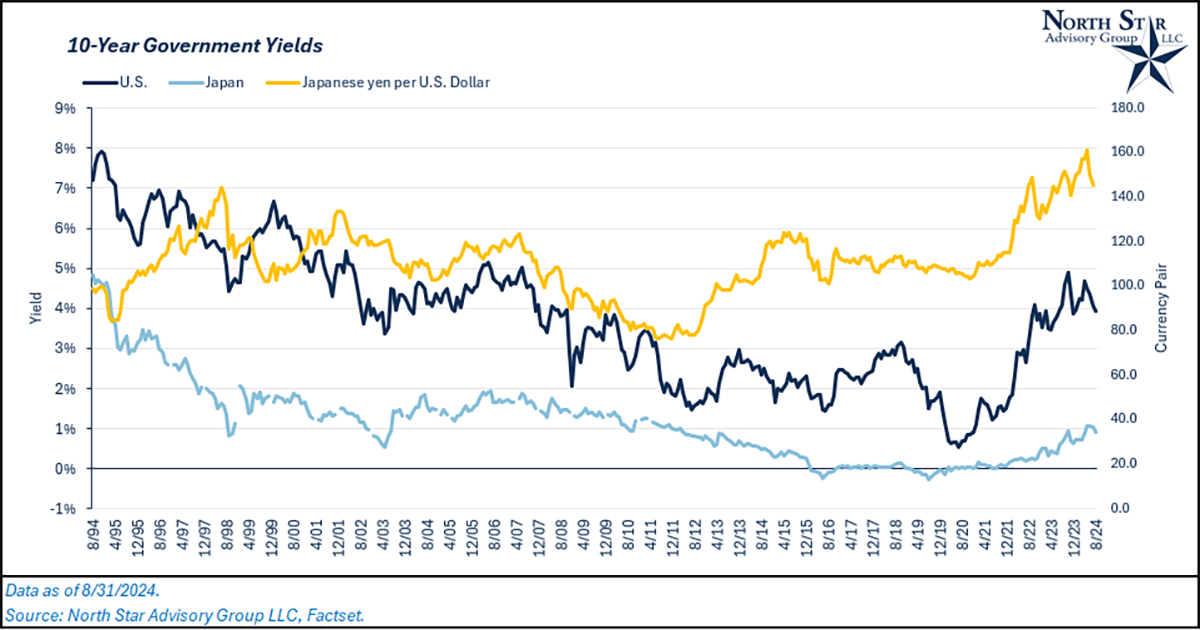
The Bank of Japan (BOJ) and the Federal Reserve are on two different monetary policy paths. The BOJ has begun tightening their policy and raising interest rates while the Federal Reserve is eyeing its first rate cut, which will likely happen in September. These conflicting policies have led the Yen to appreciate versus the U.S. dollar over the past month, while technology stocks have sold off due to concerns over the U.S. economy. From 6/30/2024 to 8/4/2024, the Nasdaq 100 Index fell 5.4% while the Yen appreciated by ~10% versus the U.S. dollar. Given that it is common to use 5x – 10x leverage when making these trades, investors quickly began losing on both ends, causing positions to be liquidated.
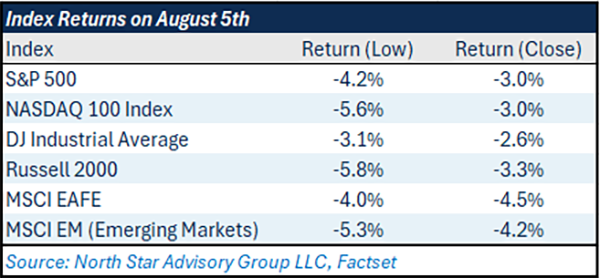
On August 5, a large number of these positions were unwound, leading to a broad selloff in global equities. The losses were magnified by these carry trades, but we still believe that the market will continue to be focused on economic fundamentals (employment), given that there were negative market reactions following weak employment numbers on August 1 and 2.
Some active managers that have been historically recommended by NSAG have occasionally used the carry trade strategy. While the immediate short-term impact to the global markets was high in 2024, most markets have already recovered those losses.
Other potential carry trades
Sticking with the carry trade topic, we investigated whether there were any other potential positions out there that could be similar to the Yen trade.
There is no clear-cut way of measuring the actual dollar amounts that are exposed to carry trades at any given time, so we must attempt to identify metrics that could’ve made an attractive carry trade over the past few years. First, we need to identify low volatility currencies from developed nations that have consistently had lower yields in comparison to the U.S. Then, we’ll have to measure whether we think the foreign currency is undervalued or not. If it is, there is potential for appreciation versus the U.S. dollar, which could unwind any open carry trades.
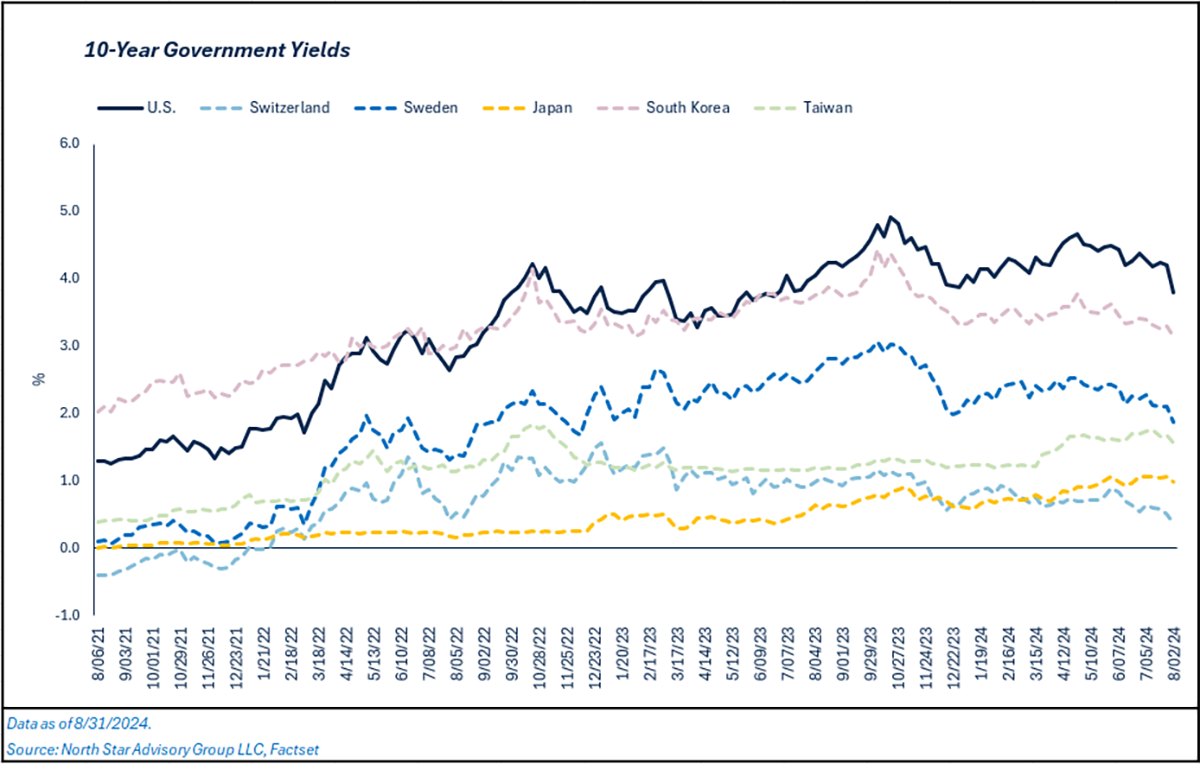
Excluding the Japanese Yen, we identified four other currencies from developed nations that have had similar volatility with lower interest rates: Swiss franc, Swedish krona, South Korean won, and the New Taiwan Dollar.
To measure whether we think a currency is undervalued, we’ll use the purchasing power parity (PPP) method, which forecasts currency values based on differences in two countries’ inflation rates. So, using cumulative inflation differences (PPP), which of the four currencies are potentially undervalued versus the U.S. Dollar? Over the past 10 years, each of the four currencies should have appreciated versus the U.S. Dollar based on inflation rate differentials over that same time period. Although, each currency actually experienced depreciation (with the exception of the Swiss Franc). Sweden and South Korea have the largest gaps between actual currency change and projected currency change.
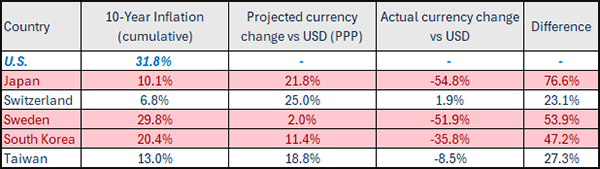
While these currencies are potentially undervalued, are there any immediate catalysts in sight that could cause a sharp rally? Both Sweden and South Korea’s central banks are considering rate hikes at this time and have been either cutting rates or eyeing a rate cut. So, the likelihood of a potential shock to their currency values is low. On top of this, interest rate differences have been much thinner than Japan’s over time, so the dollar amount exposed to any carry trades in these countries is likely not material, considering that the Japan Carry trade has been much more profitable over the years.
In summary, it’s unlikely there are any other carry trades in use to the scale that the Yen to USD trade has been used historically. In turn, the probability of another large carry trade unwind is unlikely in the short to intermediate term.
Yields
As interest rate volatility increases and the Federal Reserve is likely to make its first rate cut during the September meeting, we wanted to update clients on where yields stand for various fixed income segments from money market securities to high yield corporate bonds.
During the month of August, we saw the treasury yield curve flatten out and move closer to “un-inversion” as measured by the difference between 2-year and 10-year treasury bond yields. Over the past two years, the yield curve has been deeply inverted, and a key reason for our recommendations for limiting duration in client’s fixed income portfolios. Now that this is unwinding, it’s becoming more important to analyze multiple maturities across the curve.
Short duration (1-3 Years):
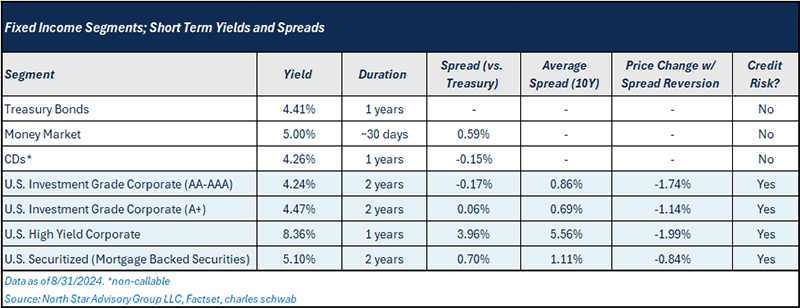
When considering credit risk, it’s important to understand where credit spreads stand in the market. Comparing current spreads versus historical averages, none of the credit risky fixed income segments listed above are attractive in our view. If spreads were to widen to historical averages, the implied price change for each segment is negative.
Intermediate duration (5-7 Years):
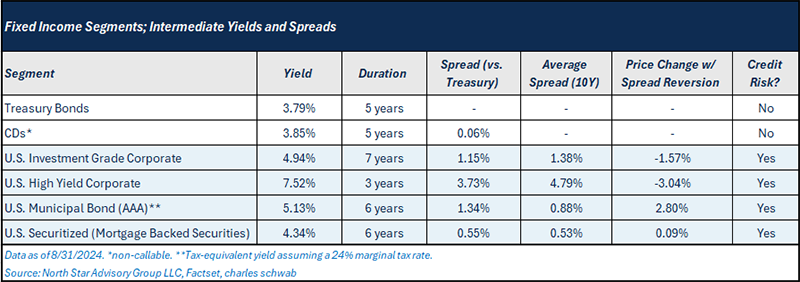
As duration begins to increase, credit spreads for both municipal bonds and mortgage-backed securities become more attractive relative to historical averages.
NSAG News - NSAG takes over Canada
In August 2024, Erik Keister and Forrest Kuchling separately traveled to Cananda in different sports and brought home victories and championships to the United States and Cleveland!
Forrest Kuchling travels to Canada with the Cleveland Zaibas co-ed softball team and brings home an international championship.
|
In 2024, Forrest swapped his gold clubs to join the Cleveland Zaibas’ (Lightning) co-ed softball team. After winning the Cleveland regional summer league, they traveled to Canada for the 30th annual Lithuanian co-ed softball international tournament in Wasaga Beach, Ontario. Wasaga Beach which is known as the largest freshwater beach in the world, just one hour north of Toronto. In August 2024, team Zaibas was joined by other teams representing other US regional leagues including Detroit, Boston and Chicago to play in the 50-team tournament. Forrest and the team played more than 10 games in three days. The team has an impressive record, having made it to the championship in the "A" division for 27 consecutive years, and they once again brought home a championship and very large trophy to the city of Cleveland! 2024 marks the 17th time Team Zaibas has won the international tournament. |
 |
Coach Keister travels to Canada with the US Women’s all-star tackle football team and brings home a victory
| What an AMAZING week. Crossing the border and being in Winnipeg Canada for the "Friendship Bowl" has truly been an IMPACT both ON and OFF the field for Coach Erik and the players alike. The week began with an opportunity to enjoy some culture experiences at the local annual folkorama festival. Then the group had the chance to impact the community with serving 500 meals for breakfast at the Siloam Mission to the homeless. They also had a couple of practices to prepare for the All-Star game with the Winnipeg Wolfpack team. If that wasn’t enough, they also held a kids camp in Winnipeg. The All-Star game was exciting as they had to play the first half with Canadian rules and the second half with American rules. It was exciting as our women’s team adapted well to the change of rules and put a 34-0 lead before starting the second half. The AFE USA All-Stars did not let up and added another 32 points in the second half, for a final score of 66-0. The USA men’s and women’s all-star teams over the last nine games have scored a combined 393 points and gave up 0. Keister has coached eight of these nine games! USA ALL-STARS elected to donate 50% of the gate proceeds to the Siloam Mission organization. |
 |
Where will the stock market go next?
August 19 marked the eighth day in a row that the S&P 500 finished higher, but it also returned the index to overbought territory for the first time since late July when looking at the S&P 500’s 50-day moving average (DMA) spread, as measured in standard deviations. Readings of ‘extreme’ overbought (oversold) levels occur when the S&P 500 close two or more standard deviations above (below) its 50-DMA and overbought (oversold) readings where the S&P 500 closed between one and two standard deviations above (below) its 50-DMA.
After the S&P 500 last closed at overbought levels on July 23, it quickly sold off and moved into 'extreme' oversold territory in just 13 calendar days. That swift pullback from overbought to extreme oversold doesn’t occur often. Just as fast as the S&P 500 moved into extreme oversold territory, though, it swung back to overbought levels nearly as fast. It only took the S&P 500 14 days to rebound from its first extreme oversold reading back into overbought territory on August 19. The market may usually take the stairs up and the elevator down, but in this case, it took the elevator both ways!
To illustrate how unusual this type of swing in the market is, since WWII there have only been 10 other periods when the S&P 500 moved from oversold levels down to extreme overbought levels and back to overbought levels in less than five weeks. The last occurrence was also the swiftest turnaround, when in June 2016 around the Brexit vote, the S&P 500 completed the ‘swing’ in just eight days! The frequency of these types of moves has picked up in recent years. While this recent occurrence was the first in eight years, since 2010, six of the 10 occurrences in the last eight decades have all come since 2010. What that says about the structure of the market and liquidity levels in the post-Financial Crisis period is a conversation for another day.
Looking through the other occurrences, many of the earlier moves typically coincided with notable market events like the Korean War (1950), the Suez Crisis (1956), the JFK Assassination in 1963, and the Fukushima earthquake in 2011. Other occurrences, however, had less concrete catalysts, tied to a weaker global economy (February 2014) or the European debt crisis (August 2014 and June 2015).
We took a closer look at the S&P 500’s performance in the one, three, six, and 12 months after the S&P 500 returned to overbought territory in each of the 10 other cycles. In review of the prior results, forward returns were mixed. While the S&P 500’s consistency of positive returns was slightly better than normal, the magnitude of the returns relative to historical averages was mixed. Median one-, three-, and six-month returns were modestly better than the long-term average, but the median one-year gain was well below the post-WWII average. While stocks have experienced breathtaking moves in the last month, we would caution against trying to read too much (good or bad) into the swiftness of the rebound.
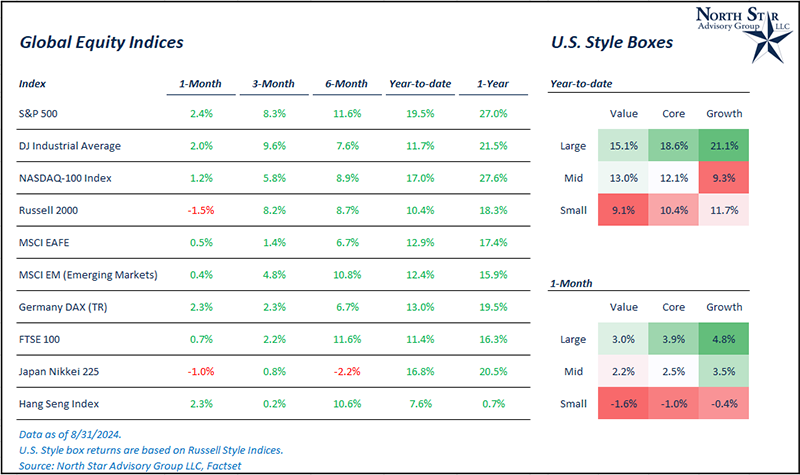
In August, we saw the stock market make positive moves following July’s pullback, with all three major indices in the green; S&P 500 +2.4%, Dow Jones Industrial Average +2%, and the Nasdaq 100 +1.2%. This includes the first couple days of the month where markets sold off broadly due to poor employment numbers and a carry trade unwind. The positive move was a reversal of July’s trends, being driven by large cap stocks. In July, large cap value (Dow Jones) and small cap (Russell 2000) led the market. In August, these two indices lagged the general market. These short-term swing movements have not been uncommon for markets in the past two years. Combining July and August, both the Russell 2000 and Dow Jones remain the leadings U.S. stock indices, +9.4% and +6.5%, respectively.
We are passionately devoted to our clients' families and portfolios. Contact us if you know somebody who would benefit from discovering the North Star difference, or if you just need a few minutes to talk. As a small business, our staff appreciates your continued trust and support.
Please continue to send in your questions and see if yours get featured in next month’s Timely Topics.
Best regards,


Mark Kangas, CFP®
CEO, Investment Advisor Representative