


Each month we ask clients to spend a few minutes reading through our newsletter with the goal of raising their investor IQ. It is important for investors to remember that the market and economy are under no obligation to make sense to investors. With an evolving economy, it is not uncommon to see things we never expected. April’s Timely Topics commentary covers client questions on investing cash, having bad luck on investment timing and diamonds.
- Diamonds, diamonds everywhere
- Investing at the worst possible time
- Sitting on cash
- Recipe/food cost saving idea
- NSAG News
- Where will the stock market go next?
Diamonds, diamonds everywhere
As Cleveland falls directly within the path of April 8’s total solar eclipse, we wanted to share some interesting facts about the rarity of this occurance and its timeline.
On average a total solar eclipse occurs on the Earth once every 18-24 months. And the odds of getting one where you live is once every 375 years or approximately 0.25% chance during one’s lifetime. This is despite the moon crossing in front of the sun twice a year as seen from somewhere on Earth.
On April 8, here is what to expect in terms of timing in Beachwood, OH (EST):
- 1:59:38 PM – Eclipse begins
- 3:14:07 PM – Totality begins
- 3:17:45 PM – Totality ends
- 4:30 PM – Eclipse ends
A total solar eclipse forms what is called the “diamond ring” (as seen in this month’s featured picture above). 2024’s diamond ring is visible just before and just after totality. It is during the 3 minutes and 38 seconds of totality that you can take off your glasses to observe the sun's corona, you may see dark-pink towers and loops of electrically charged plasma stretching many times the diameter of Earth into space. During the last total solar eclipse, in Australia on April 20, 2023, these "prominences" were spectacular and vast.
It is not uncommon for clients to inquire about investing in gold, silver and other commodities, such as diamonds, and what better time to review diamonds than during the exciting eclipse we are about to experience – and not to mention April’s birthstone is none other than the diamond. (We reviewed gold in March’s Timely Topics).
Natural diamonds have always been very valuable given the rarity of the mineral. In the late 1980s, lab grown diamonds began to be more widely available to the public. Lab grown diamonds are identical to natural diamonds in terms of the elemental compositon and appearance. The only difference is lab grown diamonds don’t carry the rarity factor. Historically, a one-carat lab grown diamond has a price discount of ~70% in comparison to natural, and that discount becomes even deeper as the carats increase.
The introduction of lab grown diamonds to the public has drawn an increased demand over the years. But, price and demand trends in both markets do not follow conventional economic theories. Over the past year, natural diamond prices have fallen by 15%, while lab grown diamond prices have fallen by 34%. Given these price trends, it makes sense why lab grown diamonds have continued to have strong demand. Although, natural diamonds have also increased in demand. So, why aren’t consumers shifting down from natural to lab grown diamonds? The rarity factor of a natural diamond can’t be replicated in a lab. It is the same reason why other luxury goods have increased demand when prices also increase (exotic cars, watches, purses, etc.).
Growth of the lab diamonds will likely continue as consumers and commercial users continue to seek a way to reduce their cost of procuring this precious gem.
Investing at the worst possible time
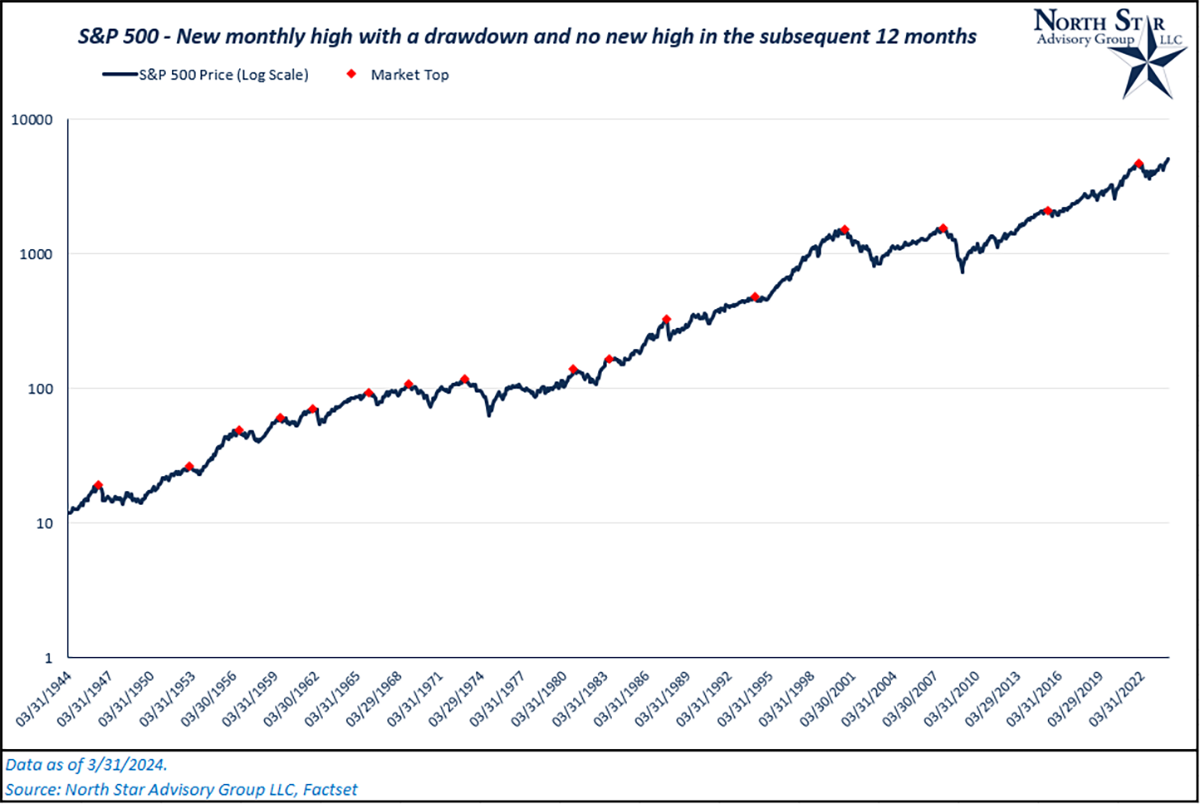
When thinking about the rarity of a total solar eclipse, we can also think about the rarity of certain market events and distorted perceptions of these events. It is not uncommon for investors to find themselves holding cash on the sidelines out of fear that they would be investing at the worst possible time (for example, the top of the market cycle). If we were to pick any random month end period to begin investing from the past 80 years, what is the probability that we would actually pick a market top*? That probability is ~1.7% (16 occurrences). Higher than a total solar eclipse, but still very low.
*NSAG defines this market top as a month-end new high for the S&P 500 with a drawdown and no new high over the subsequent 12 months.
Now, let’s assume an investor decided to invest their money over 16 equal periods during the past 80 years, and they happened to choose all 16 market tops as points of deployment (red diamonds on the chart below). Our average annualized return from our stock investments over this time period would still be 6.08%. So, while the investor had one of the worst possibly timed stock investment strategies, they still earned an annual return that is higher than most investment grade corporate bonds currently in the market. There is a near zero probability of actually timing your stock investments this poorly based on historical index data.
For additional comparison, the Bloomberg Aggregate Bond Index produced an annualized return of ~6.5% over the past 45 years (earliest data available), while the S&P 500 produced an annualized return of ~8% over the same 80-year period discussed above.
Sitting on cash
With interest rates at their highest levels since 2007, clients continue to weigh their options on which types of investments should be used to store their cash holdings. From cash to money markets to CDs, we wanted to give a quick refresher on where rates currently stand for these different investment options and the risks involved in each. Additionally, we compare nominal rates and real rates, which account for the negative impact of inflation on cash’s purchasing power.
Inflation rate as of February 2024, measured by the year over year change in CPI: 3.2%. Real Yield = Nominal Yield – Inflation Rate.
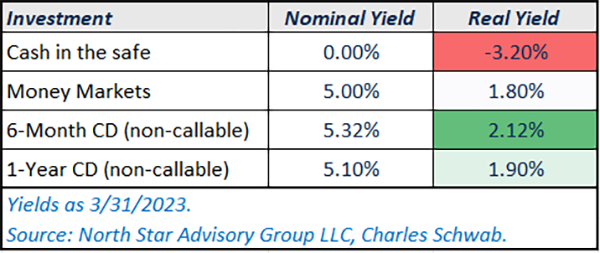
Outside of simply comparing the yields, each of these investments carries differing risk-factors and characteristics. CDs have fixed coupon rates over the life of the bond, which makes the value of the bond exposed to interest rate risk. If interest rates rise, fixed bond prices fall and vice versa. Although, this interest rate risk is only realized if the CD is sold prior to its maturity as the mature at face-value. NSAG purchases CDs for clients with this in mind. Additionally, CDs carry FDIC Insurance protection. On the other hand, money market funds have variable interest rates (minimal interest rate risk) and are closely tied to the federal funds rate.
To give an example, let’s say an investor purchases a money market fund and a 6-month CD at the same time and the federal reserve subsequently decides to cut their target rate by 0.25%. The investor’s money market fund will likely now yield around 4.75% while the 6-month CD will still carry the 5.3% rate through maturity, making the CD more valuable. Although, this same effect can work in reverse and lower the CD’s value. Again, this is only a material factor if the CD is sold prior to maturity.
Recipe/food cost saving idea
Roasting some chicken on the weekend can help bring lunch costs down during the week. Use this simple recipe to have chicken on hand to put in a salad or sandwich. This flavor palate is generic enough to work with many different sandwich/salad options.
Ingredients: 1 pound boneless, skinless chicken breasts Salt (any kind you like – pink, kosher, sea salt…)
1 teaspoon each of garlic powder, onion powder, paprika, oregano Pepper 2-3 Tbsp olive oil
Generously sprinkle chicken with salt and let it sit in the fridge for 4 hours or up to overnight. When you’re ready to cook the chicken, preheat the oven to 425 degrees. Let the chicken sit on the counter while you whisk together the seasoning mixture. Since the chicken is already salted, sprinkle a little pepper on both sides of the chicken. Rub the chicken with the olive oil and sprinkle with the seasoning mixture on both sides and place chicken on a baking sheet. Bake for 20-25 minutes until the chicken is 165 degrees measured by a meat thermometer or cooked through. Let the chicken rest for 10 minutes and then slice thinly and use on salads and sandwiches throughout the week for lunch. Enjoy!
NSAG News
To maintain our high level of service, NSAG’s staff is growing. Stay tuned as we officially announce our new hires in May’s Timely Topics!
Where will the equity markets go next?
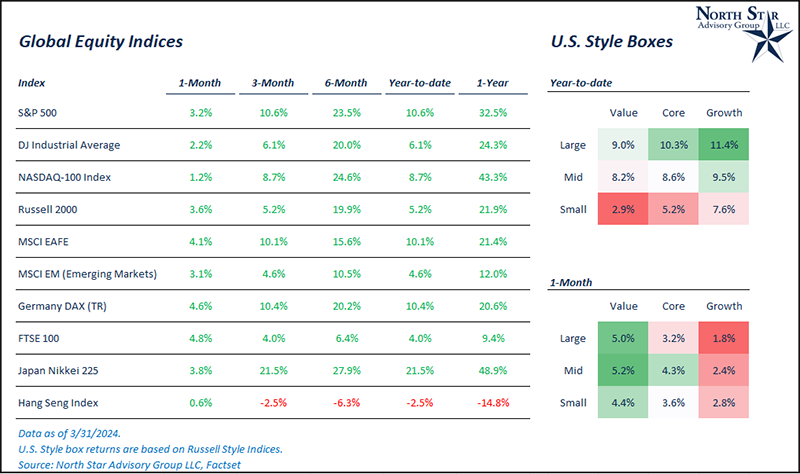
In the beginning of March, we wrote to clients that they should not be surprised by a short-term pullback in the markets during 2024. In March, we did not get this pullback as the S&P 500 continued to climb (+3.2% for March 2024). Although, we did get a bit of sector rotation in March with more cyclical and value style sectors performing the best. The top 4 sectors in terms of total returns for March were energy (up 10.5%), utilities (up 6.6%), materials (up 6.5%), and industrials (up 4.4%). The worst performing sectors were consumer discretionary (down -0.10%) and technology (up only 0.80%). These performance metrics are based on the SPDR Sector Indices.
Interest rates were relatively flat throughout March as the U.S. 10-year yield closed at 4.20% (4 basis points (bps) lower than the end of February). While treasury rates are flat to slightly down, the probability of a rate rut in May’s FOMC meeting has fallen. Over the past 24 months, the market has typically overreacted (up and down) to FOMC meetings. March’s meeting did not produce such an overreaction from the markets, despite further solidifying that the policy rate will likely not be cut until June. A decrease in the volatility of interest rate movements can be a positive sign for both the stock and bond markets as businesses have less uncertainty around the direction of future monetary conditions. As of 3/31/2024, the market is still pricing in expectations of three 25 bps cuts to the policy rate by year end. Even with three cuts, NSAG continues to remind investors that rates are likely to stay higher for longer.
Globally, international developed markets were up 4% in March, outperforming U.S. markets. This outperformance was led by Germany and Japan.
We are passionately devoted to our clients' families and portfolios. Contact us if you know somebody who would benefit from discovering the North Star difference, or if you just need a few minutes to talk. As a small business, our staff appreciates your continued trust and support.
Please continue to send in your questions and see if yours get featured in next month’s Timely Topics.
Best regards,


Mark Kangas, CFP®
CEO, Investment Advisor Representative