


Each month we ask clients to spend a few minutes reading through our newsletter with the goal of raising their investor IQ. November’s Timely Topics commentary analyses several recent questions from clients.
- Israel-Hamas War
- Inflation update
- Economics and the market
- Mutual fund versus exchange traded trends
- NSAG news
- Where will the equity markets go next?
Israel-Hamas War
On 10/7/2023, the Hamas from Palestine launched a deadly attack on Israel, which has since prompted a response from Israel and plunged the two countries* into war. Several clients have inquired about the potential impact of the war between Israel and Hamas on their portfolio. To help answer these questions, we are setting aside the humanitarian aspect so we can focus our thoughts on the economic impact. For those that are not aware, the country of Isael is roughly the land size and population of New Jersey. While the markets have decreased slightly since October 7, the negative market impact is being driven by rising interest rates, rather than the war. The interest rates have been putting downward pressure on the markets.
Going forward, it is important to continue to analyze and monitor the potential economic implications that this war might have, especially if the conflict spills into bordering countries in the region.
Since 10/7/2023, here is how the markets have changed:
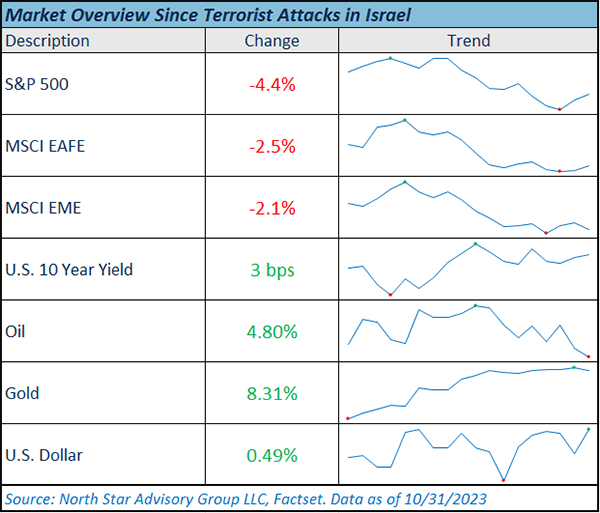
While equity markets have decreased due to higher bond rates over the past few months, we’ve also seen a bit of a risk-off trade since 10/7/2023, putting equities into oversold territory. Oil and gold are both notably higher since 10/7/2023. Given this conflict is taking place in the Middle East, it is easy to understand the potential negative implications for global oil markets.
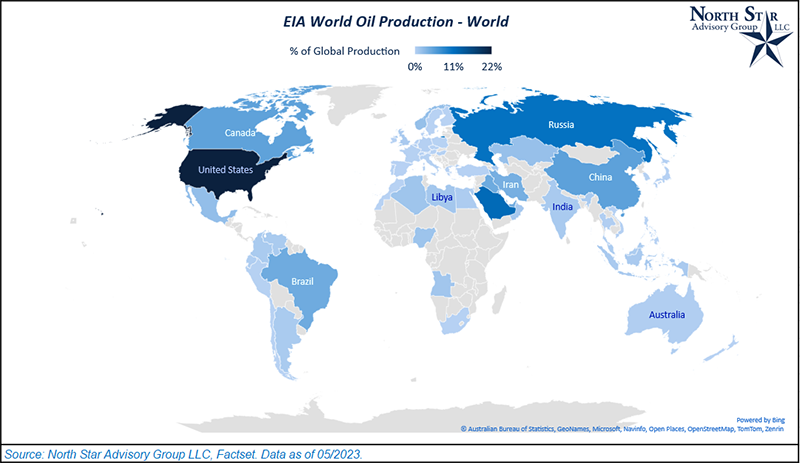
Within the Middle East region, 21% of global oil production comes from countries that surround Israel:
- Saudi Arabia: 12%
- Iran: 4%
- Iraq: 4%
- Egypt: 1%
Trade disruptions and oil export sanctions between these countries and the U.S. are not currently likely unless the conflict were to spill into surrounding countries. Historically speaking, Israel and Saudi Arabia had a rocky relationship until recent years when Israel had begun plans to normalize their relationship. The U.S. had been leveraging their friendly relationship with Saudia Arabia to facilitate conversations between the Saudi and Israeli governments. These plans have now been halted due to the conflict. There is a concern that tensions could flare and cooperation between the U.S. and Saudi Arabia could be strained if conflict were to spill into any of these neighboring nations who are not allies of Israel. While energy is a cyclical component of inflation, it’s still possible that we may see short-term upward pressure on inflation from oil prices as the situation in Israel and Palestine develops. Recent increases in U.S. oil production could help to soften the impact of lower oil availability.
Below, we’ve included a heat map showing the primary producers of oil across the globe.
* Not all countries and/or members of the United Nations General Assembly recognize Palestine as a country.
Inflation update
As the markets analysts continue to monitor inflation expectations and the current path of inflation, NSAG feels it is important to continually update our clients on where inflation appears to be heading and what is happening under the hood.
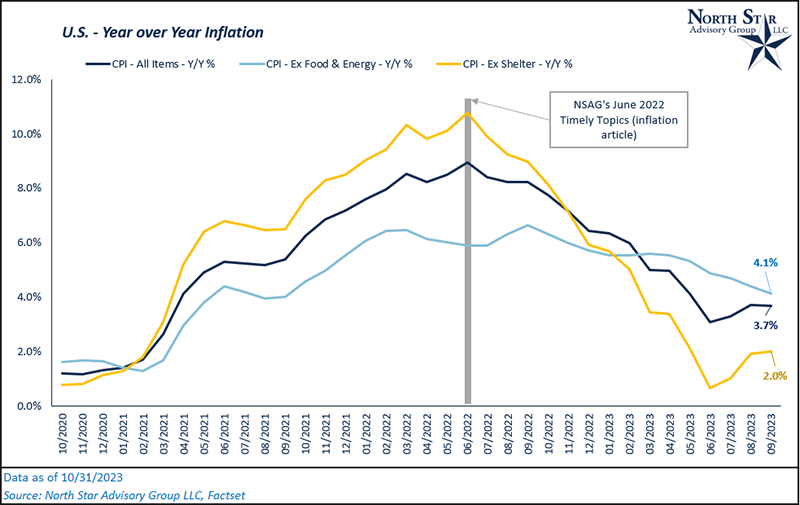
In September 2023, Core CPI (CPI excluding food and energy) continued on its disinflationary path to a year-over-year value of 4.1%. Core CPI removes the price impacts from food and energy given those component’s volatile nature. You’ll notice that the year-over-year change for Core CPI has been much less volatile over the past three years in comparison to the CPI indices that include food and energy.
CPI All Items increased slightly in September, relative to recent months, with a year-over-year value of 3.7%. This was caused by an uptick in energy prices. During the month of September, WTI crude oil prices increased by 28% from 8/31/2023 to 9/30/2023. As noted in the previous section, oil has increased another 4.8% since the 10/7/23 attack on Israel.
Lastly, in the chart below, we’ve compared CPI All Items and Core CPI with the impact of removing shelter from the CPI All Items Index. Since June 2022, we’ve seen CPI Ex Shelter fall at a much quicker pace to 2% year-over-year in September, while the other two indexes that include shelter remain higher. This tells us that shelter has been a primary inflation driver over the past 15 months. Rent prices that are used to calculate changes in shelter are partially calculated using estimates which are influenced by mortgage rates. In reality, actual rents have not seen a comparable increase to the increase in actual mortgage payments. This tells us that shelter may be artificially inflating the primary two CPI indices (All items and Core).
According to the U.S. Census Bureau’s Current Population Survey/Housing Vacancy Survey from March 15, 2023: the homeownership rate in the U.S. was at 65.9% during the fourth quarter of 2022 and was not statistically different from the fourth quarter of 2021 (65.5%) or the third quarter of 2021 (65.4%). This 65% of the U.S. population is fairly immune to the recent rise in interest rates and have experienced an inflation trend similar to the yellow line below. While renters are generally represented in the dark blue line below and have experienced a dramatically different inflation rate pattern.
As a reminder, the Federal Reserve has an inflation target of 2% with an upper and lower band of 1%.
Economics and the market
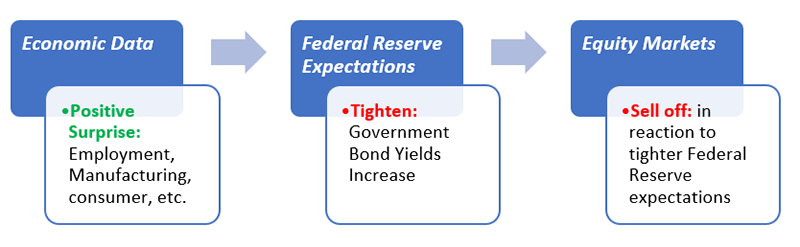
A recent trend we’ve seen has been that good economic news has equated to bad news for equity markets. We saw this trend in 2022, and over the past few months, it has reappeared and persisted. In an environment where the Federal Reserve continues to implement a tight monetary policy, strong economic data has generally led to poor equity performance on a day-to-day basis (Good = Bad). Why is this the case?
Historically, equity markets are heavily influenced by interest rates and Federal Reserve policy expectations. This relationship has not changed over the past 18-24 months. On days when strong economic data is released, whether it be employment, consumer, or manufacturing data, etc., we’ve generally seen expectations for tighter Federal Reserve policies increase. This is evidenced through increased interest rates on long-term government bonds. As the expectations for a tighter Federal Reserve increase, equity markets tend to sell off in lockstep. This trend has been somewhat of a chain reaction-like occurrence.
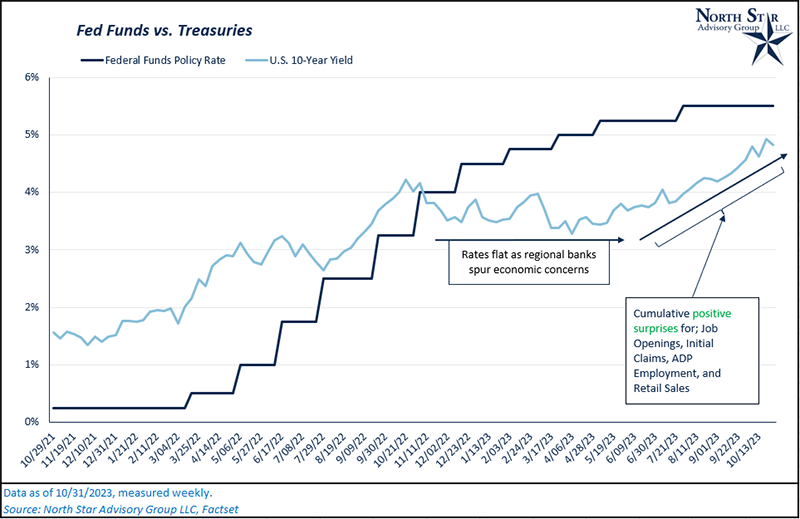
It is important to remember that equity markets are forward looking, and the strong economic data that comes out today is influencing investor’s perception on what they think the Federal Reserve will do over the next 9-12 months. With that being said, despite recent market reactions, we are seeing an underlying economy that continues to strengthen. Since June, we’ve seen cumulative positive surprises for various macro data points such as the number of job openings, retail sales growth, ADP unemployment, and initial unemployment claims to name a few. These positive surprises have led many to believe the economy is not going to enter a deep recession or a recession at all. A stronger economy could allow The Federal Reserve to keep their policy rates higher for longer, versus prior market expectations in early 2023 which were expecting for rate cuts in late 2023 to offset a recession. If The Fed’s policy is to keep interest rates higher for longer, the 10-year yield needed to increase to close the gap between its relative position in May of 2023. Much of this increase in the 10-year yield was done by the market and not by additional rate hikes by The Federal Reserve. As we wrote in September’s Timely Topics, the debt downgrade of the U.S. Treasury on August 1, 2023 also caused the 10-year yield to increase. NSAG created the following chart to help show the recent Federal Funds policy rate changes compared to the U.S. 10-year yield.
Mutual fund versus exchange traded trends
Many clients have had questions about their investments in mutual funds and how these positions are reported from a tax perspective. The way in which the mutual fund vehicle operates is different from an exchange traded fund (ETF). The differences can distort an investor’s perception of their actual return/experience when viewing tax basis information on an account statement. Due to the large influx of questions on this topic, we thought it’d be a good idea to break down the key differences between a mutual fund and an ETF.
Trading
ETFs trade on major stock exchanges throughout each trading day (just like individual stocks). This means that ETF shares can be traded intra-day, can be shorted, and prices track very closely with the ETF’s net asset value (NAV). This is enabled by the creation/redemption process for ETFs. The creation process occurs when an investor purchases an ETF in their account and the authorized participant (AP) purchases that ETF’s basket of underlying securities. The AP then sells (creates) the ETF shares to sell to that investor. Lastly, the basket of underlying securities is delivered from the AP to the ETF sponsor.
For mutual funds, investors buy and sell shares directly with the fund company. There are no intermediaries or authorized participants. Mutual funds do not trade intra-day as they are valued once per day at the end of each trading day.
Taxes and realized capital gains
Typically, ETFs do not distribute realized capital gains to investors due to the tax-efficient nature of the creation/redemption process. On the other hand, mutual funds must distribute their fund’s net realized capital gains to investors on an annual basis. A mutual fund with higher turnover will have a greater likelihood of distributing a larger capital gain to investors, as there is more frequent trading occurring within the fund. When a fund distributes their capital gain, the fund’s NAV is lowered by the distribution amount, which also lowers the unrealized taxable gain on that investor’s statement. Put another way, distributions could increase a taxable loss. All else equal, mutual fund and ETF investors will pay a similar amount in total taxes on their investments. The primary difference is that a mutual fund investor’s tax bill will be spread out across the holding period.
Having taxes spread out may decrease the taxes paid on capital gains. Delaying capital gains can also increase the mental hurdle to sell an investment.
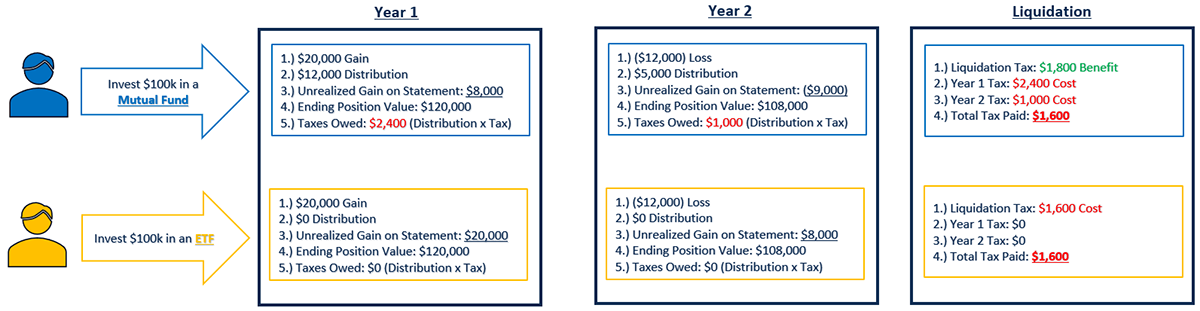
As seen in the hypothetical scenario above, it is more than possible for a mutual fund investment to show an unrealized loss on an account statement, despite actually experiencing a gain, but that does not necessarily mean the investor has experienced a loss. Below, we’ll walk through the mutual fund investor scenario.
In year 1, a $100,000 investment into a mutual fund generates a $20,000 gain and the fund distributes $12,000 in the form of realized capital gains. The price of the fund is lowered by the distribution amount and the investor owes taxes on that distribution. Since the fund price is lowered, the investor’s unrealized gain falls to $8,000 ($20,000 - $12,000), but still received a cash payment of $12,000 (which can be reinvested for more shares), so the total return remains at $20,000.
In year 2, the fund generates a loss of $12,000 and still distributes a $5,000 capital gain due to turnover in legacy positions. Investor pays taxes on that $5,000 distribution, but the unrealized gain is now an unrealized loss of $9,000 ($8,000 - $12,000 - $5,000 = -$9,000). The investor still has a positive return of $8,000 ($20,000 - $12,000) over the holding period of the investment. The investor can now liquidate their position and receive a taxable benefit despite having a gain due to the fact that taxes were paid periodically over the investment holding period. Looking back at the table, you’ll notice that in liquidation, the total taxes paid for the mutual fund investor is equal to the ETF investor assuming the same tax rate (20%).
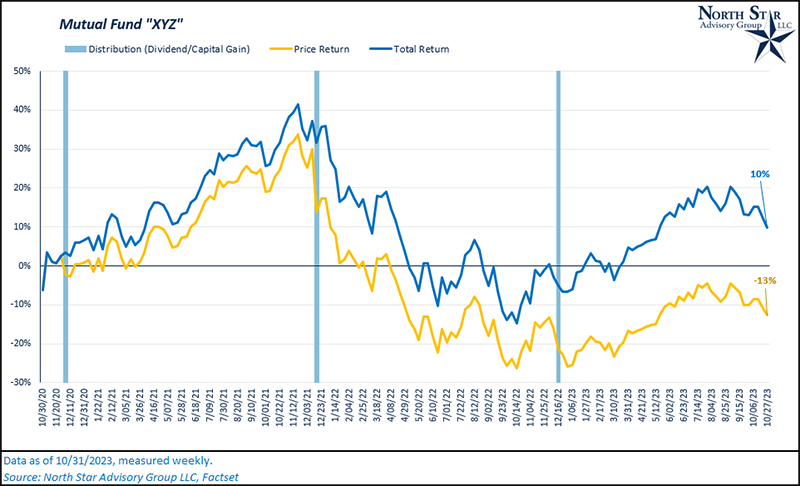
Lastly, we’ll analyze a real-world example in the chart below. For this example, we are using real mutual fund results, but keeping the fund’s identity private. In orange, you’ll see that the price return for the fund over the past three years is -13%. This measure does not include capital gain and dividend distributions from the fund over that same three-year period. The share price of the mutual fund continually decreases by the amount of each distribution. Although in reality, the actual total return for an investor who held this fund for three years was +10%, not -13%. The difference between the two measures grows over time as more distributions are pushed out of the fund. If you have any further questions on this topic, we encourage you to reach out for further discussions.
NSAG news

We are very pleased to announce that Brian Duffield passed the August 2023 Level 3 Certified Financial Analyst (CFA) Exam. The global pass rate was only 47% for Level 3! Considering only 27% passed Level 1 in 2021, and only 40% passed level 2 last year, passing Level 3 puts Brian in the top 5% of those who began working through the CFA program in November 2021, having passed each of the three levels of the CFA program on his first attempt.
Brian is now pending approval of his application to become a CFA Charter holder and a member of the CFA Society of Cleveland.
The continued success of NSAG’s practice and our employees’ passing rate of certifications is a huge credit to the dedication we bring to each and every one of our clients. Cheers Brian!
More about the CFA designation:
A Chartered Financial Analyst (CFA®) charter is a designation given to those who have completed the CFA® Program and completed acceptable work experience requirements. The CFA Program is a three-part exam that tests the fundamentals of portfolio management, asset valuation (Equity, Bond, and Alternatives), economics, corporate finance, complex trading strategies, and wealth planning.
Where will the equity markets go next?
NSAG is sensing an overall media fatigue due to the impact interest rates are having on the housing and stock markets, the new war in the Middle East, the continued war in Ukraine, concerns over China’s real estate market and sights on Taiwan, union strikes, and let’s not forget political disfunction in Washington to round out the top few concerns on investor’s minds. We understand it can be difficult to be an investor during times like this. As reviewed above, it is important to remember that overall economic numbers continue to come in better than many Wall Street analysts expected, which ironically increases The Federal Reserve’s chances of keeping rates higher for longer to hit their inflation target of 2%. Furthermore, despite the rise in oil prices, many households and our clients are already experiencing a 2% inflation rate.
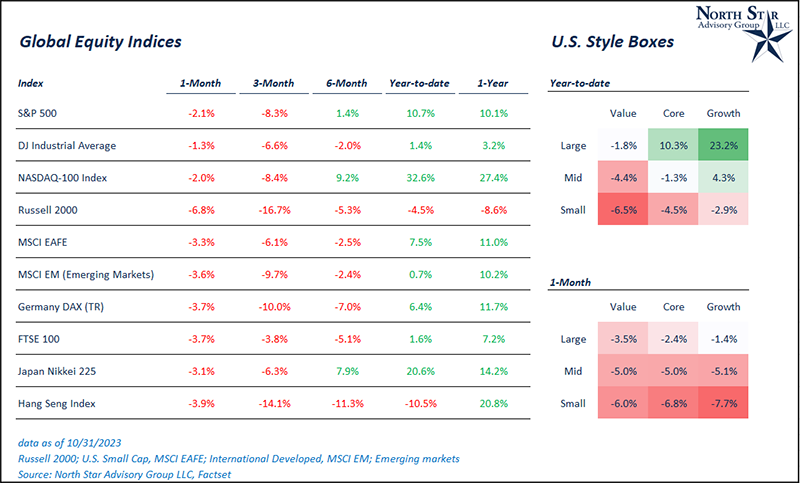
From a market perspective, the last full week of October was a lousy one for US stocks. While the S&P 500 was down less than 1.5% for the month of October heading into the week, it finished 10/27/23 down just under 4%. What was notable about the declines, though, was in how uniform they were. In a market that has been so uneven for at least the last year (see the YTD performance numbers in the fourth column), all fourteen of the US index ETFs we track were down more than 2% but less than 3%. Another common theme? All of them are at ‘Extreme’ oversold levels.
We are passionately devoted to our clients' families and portfolios. Contact us if you know somebody who would benefit from discovering the North Star difference, or if you just need a few minutes to talk. As a small business, our staff appreciates your continued trust and support.
Please continue to send in your questions and see if yours get featured in next month’s Timely Topics.
Best regards,


Mark Kangas, CFP®
CEO, Investment Advisor Representative