


Each month we ask clients to spend a few minutes reading through our newsletter with the goal of raising their investor IQ. April's edition of Timely Topics focuses on how different asset classes have reacted to the war in Iran along with the ripple effects from a disrupted energy market on global economies.
Many people forget that the original space race grew directly out of ballistic missile technology, rockets designed for war that were quickly repurposed for exploration. Decades later, that connection feels newly relevant. Artemis II represents a return to deep space ambitions, carrying humans farther from Earth than we have gone in generations and signaling a renewed push to operate beyond our planet. At the same moment, conflict on Earth is being reshaped by technology, with drone warfare redefining how power is projected in the Middle East and in Ukraine. From orbit, borders look small, but technology links these stories together. The cover image, a view from space looking down on the Middle East and Iran, captures this tension between exploration and conflict, and reminds us that the tools we build can elevate humanity or intensify its divisions.
- Update on the war in Iran
- Shock to the oil trade
- Inflationary impacts
- Gulf War comparisons
- NSAG News
- Where will the stock market go next?
Update on the war in Iran
Since the United States began large scale military operations against Iran on 2/28/2026, the conflict has continued to intensify into a sustained regional war defined by persistent air campaigns, missile exchanges, and expanding operational scope. U.S. and allied forces have maintained pressure through ongoing strikes on Iranian military infrastructure, while Iran has escalated retaliatory attacks across the region using drones and ballistic missiles targeting U.S. assets and partner countries. Recent days have also seen continued damage to military equipment and aircraft on both sides, alongside growing casualties and operational strain. At the same time, disruptions tied to the closure of the Strait of Hormuz have severely impacted shipping and global energy flows, reinforcing the broader economic consequences of the conflict.
Over the past week, developments pointed to further escalation risk and widening geopolitical complexity. The United States has deployed additional troops to the region and is actively considering limited ground operations, even as officials publicly leave the door open to negotiations, while Iran has warned of severe retaliation in the event of any ground incursion. Diplomatic fractures are also emerging among Western allies, with countries like Spain restricting support for U.S. military operations, highlighting growing international divisions over the war. Meanwhile, both sides continue to signal conflicting intentions, combining military escalation with intermittent diplomatic outreach, leaving the trajectory of the conflict highly uncertain and increasingly shaped by battlefield dynamics and external political pressures.
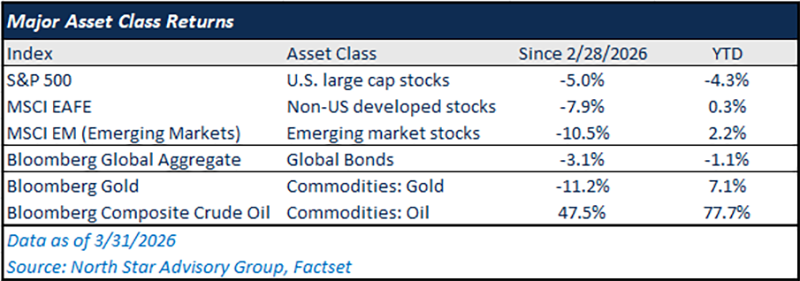
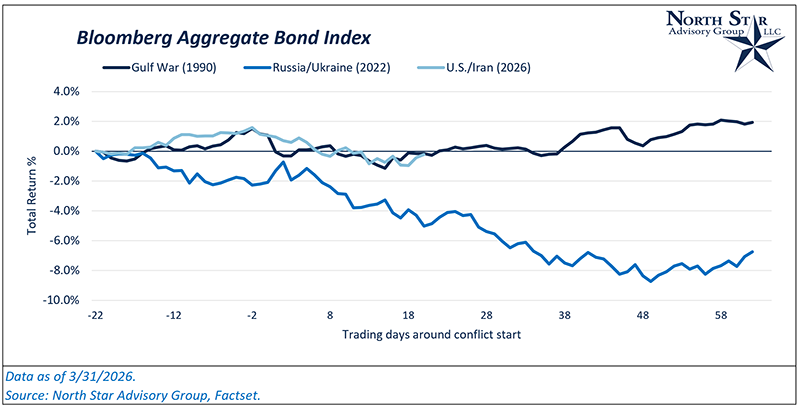
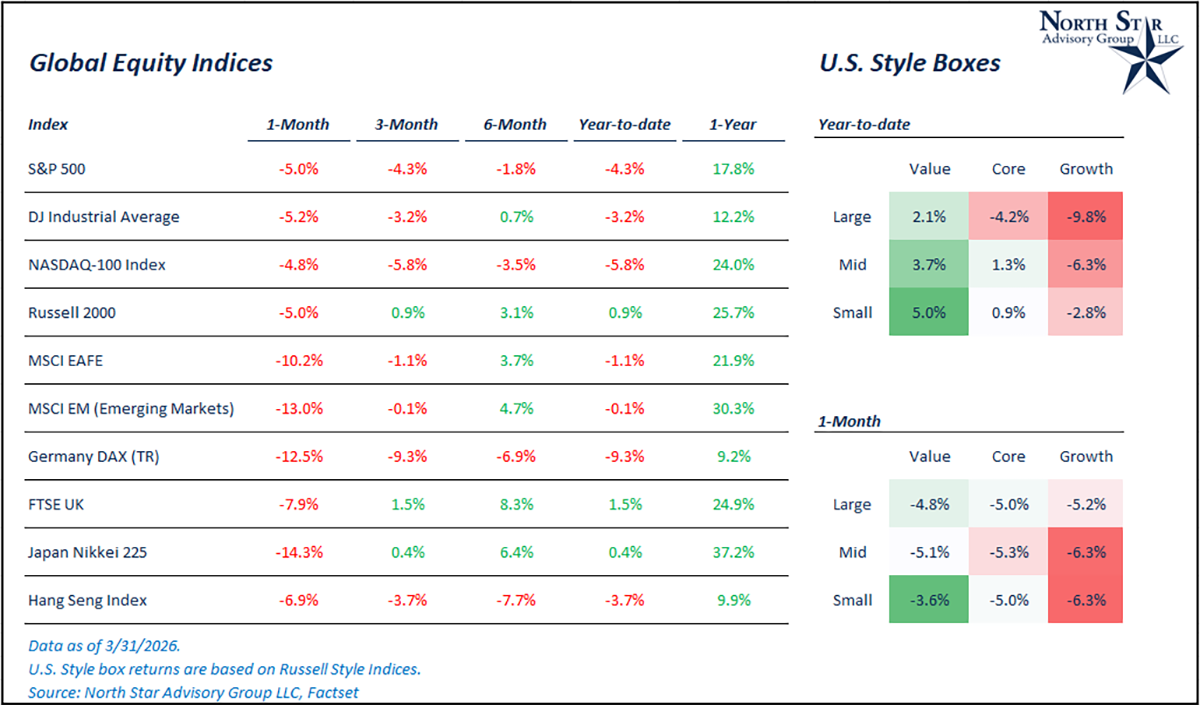
In the table below, we’ve quickly recapped major asset class returns on a year-to-date (YTD) basis and also shown the performance since the war broke out on 2/28/2026. One month into the conflict and stocks remain down, with the most pain being felt outside of the U.S. That being said, non-U.S. stock markets are still leading year-to-date as of 3/31/2026. Interestingly, gold has fallen by more than 11% since the conflict ignited, despite its safe-haven status. With various conflicts emerging over the past four years, an inflation crisis in 2022, and concerns over fiscal spending/Fed independence, it’s likely that gold buyers may be tapped out. Bonds have offered limited downside protection, as rising oil prices are fueling inflation worries and driving up interest rates. Bonds will likely offer limited upside potential when the conflict is over.
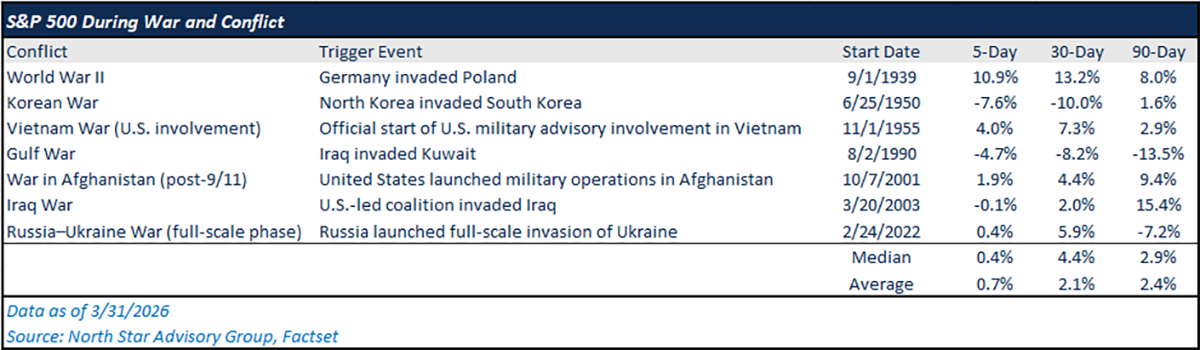
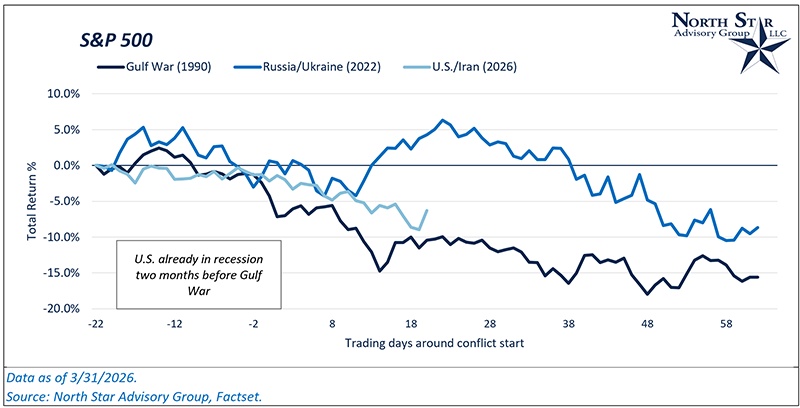
In the past, major conflicts have had muted downside impact on U.S. stocks. In the table below, we’ve summarized returns for the S&P 500 following the onset of different conflicts historically. Over the next 5-, 30-, and 90-day periods, the S&P 500 has been positive on average following these trigger events. We do note that one of the more significant draw-down periods occurred during the Gulf War, which leads us to a conversation on oil in our next section.
Shock to the Oil Trade
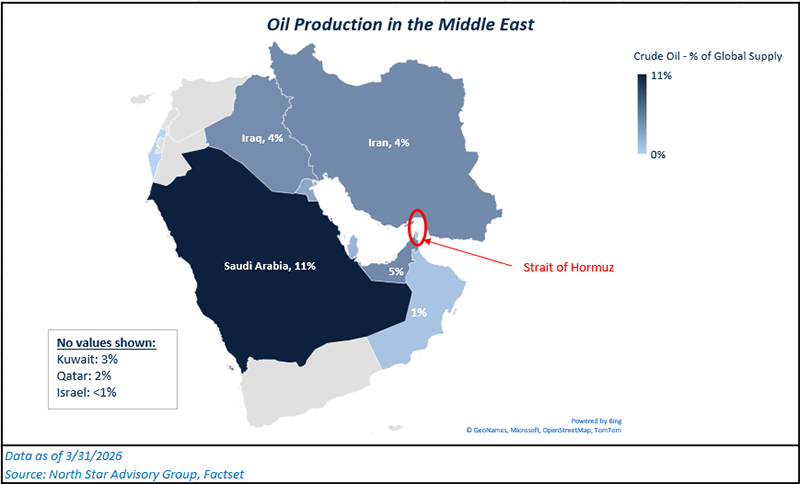
The Strait of Hormuz is a 21-mile-wide strait which connects the Persian Gulf to the Arabian Sea. For context, Lake Erie’s widest length is ~57 miles. Around 23% of the global maritime oil trade flows through this Strait, and that equates to ~21 million barrels per day of flow. Around 70% of this flow goes to Asian markets such as China, South Korea, Japan, etc. Oil shocks in this region of the world hurt these economies more directly, and that is why we have seen a stronger drawdown in non-U.S. stocks since 2/28/2026.
We’ve provided a visual below that illustrates why the Strait of Hormuz is considered the most critical chokepoint in the global energy trade, particularly for Asian economies. Just about 30% of all global production is clustered in these Middle Eastern countries, and many of their refineries are located around the coastline of the Persian Gulf.
Since the war began, Iran has disrupted tanker traffic in the Strait by attacking vessels, causing shipments to stop and insurance costs to rise. This has been their most effective counter-measure as it inflicts pain to global economies through higher input prices for energy and also puts political pressure on the Trump administration. The U.S. has taken temporary measures to stabilize markets and keep oil flowing, but these actions do not address the ongoing geopolitical risks in this key energy region.
Key stabilization measures include:
- Releases from the Strategic Petroleum Reserve to offset supply shocks
- Diplomatic pressure on OPEC members and partners to increase output
- Support for incremental increases in U.S. domestic production
- Expanded naval presence (escorts) to help secure shipping lanes through the Strait of Hormuz and limit disruptions
- U.S. backed wartime insurance coverage for tankers traveling the strait
Despite various efforts, oil prices remain high as current measures are only temporary fixes. Prices will likely drop only if Strait crossings return to pre-war levels and threats to tankers are fully addressed. If higher energy prices persist, there is a strong likelihood that it negatively impacts republicans in the mid-term election cycle. Due to this, we would not be surprised to see the Trump administration continue to look for an off-ramp in the conflict or become even more aggressive in securing the Strait through military force.
Inflationary impacts
Due to a spike in oil prices, there are renewed investor concerns over inflation, and how that may impact the Federal Reserve’s job of bringing inflation back down to 2% while maintaining stability in the labor market. This is a balancing act that the Fed and Jerome Powell have been navigating since the implementation of tariffs in 2025.
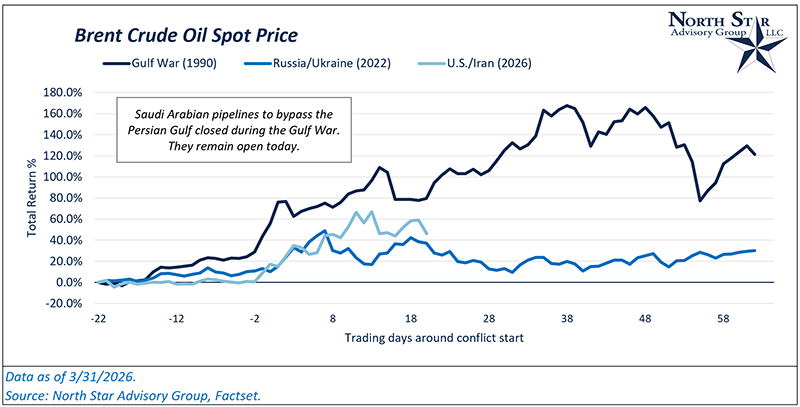
Since 2/28/2026, oil prices have soared by 52% and are up 83% on year-to-date basis as of 3/31/2026, as measured by the Bloomberg Composite Crude Oil Index. Oil markets sit at the center of the global economy because they directly influence transportation costs across shipping, aviation, and trucking, which in turn affect the price of nearly all traded goods. They also feed into broader energy systems, impacting electricity generation, manufacturing input costs, and even agriculture, which means fluctuations in oil prices ripple through virtually every sector via both fuel and supply chain costs. Inflationary fears have driven interest rate levels higher as the 10-year yield has increased by ~40 bps to 4.3%.
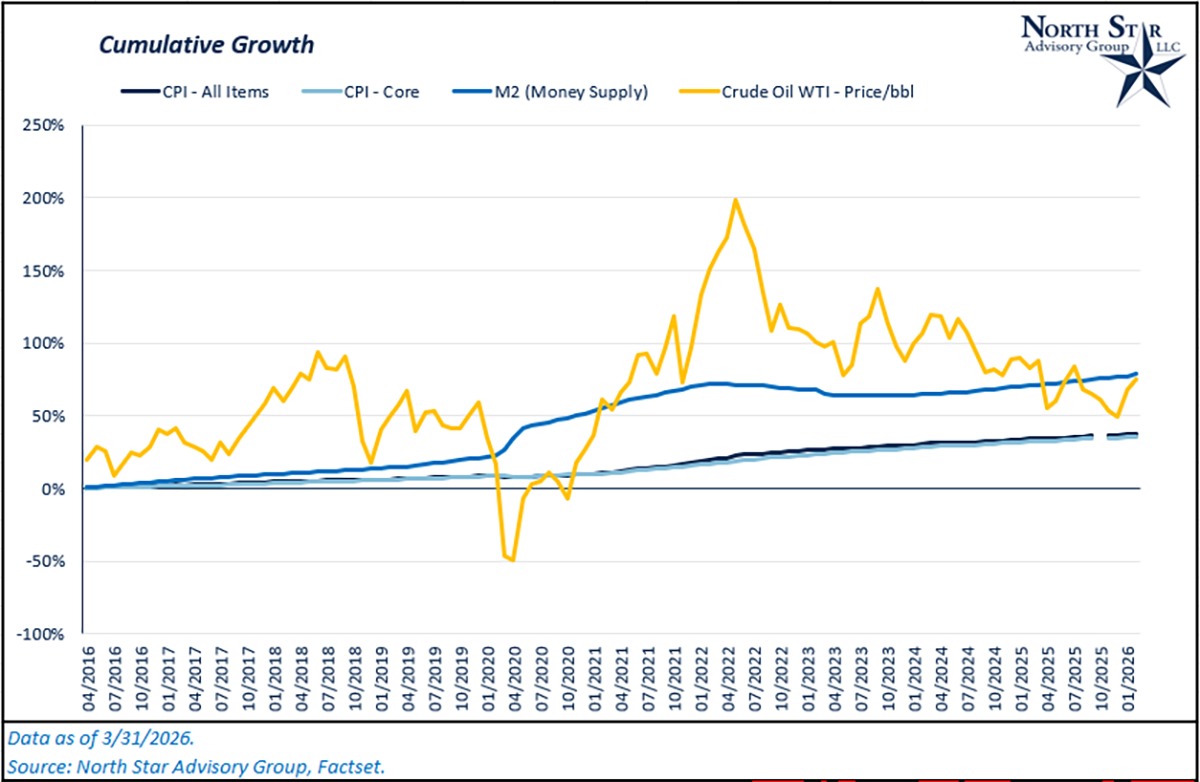
Energy-driven cost spikes tend to be transitory for inflation because they reflect supply shocks that either normalize as production adjusts or fade out of year-over-year comparisons, limiting their lasting impact on the overall price level. By contrast, sustained growth in the money supply and aggregate demand relative to productive capacity is what drives structural inflation over time, embedding broader and more persistent price increases across the economy. This is why the Bureau of Labor Statistics has an inflation index for all items (“CPI”) and a secondary inflation index, which excludes energy and food, termed “Core CPI”. In the chart below, we’ve illustrated the change in both CPI indices versus the change in oil prices and the money supply over the past 10 years. Overall, prices tend to be much more correlated with the money supply. We don’t expect the war in Iran to structurally change the disinflationary path that CPI has been on ever since 2022.
Gulf War comparisons
In the opening section, we presented a table illustrating the short-term returns of the S&P 500 following the onset of significant historical wars and conflicts. It is logical to draw comparisons between the current conflict involving the U.S. and Iran and the Gulf War. Although there are notable differences in terms of opposition, coalition composition, and economic context, the geographic region, commodities involved, and regional economic implications from combat remain consistent.
One month into this conflict, we’ve seen oil spike, stocks fall, and bonds fall as well as interest rates rise alongside inflation expectations. In comparison to the Gulf War of 1990, the stock selloff has been less severe, and the oil spike hasn’t been as sharp. When comparing these two conflicts, the differing economic backdrops must be taken into consideration to add context. Two months prior to operation Desert Storm (Gulf War), the U.S. had entered a recession, and stock markets were already under pressure, explaining the gap in performance for the S&P 500 between the two periods.
Throughout both periods, the Federal Reserve maintained a consistent cycle of rate cuts, which contributed to strong bond performance during the Gulf War. In 2026, bonds saw gains before the conflict but declined as rising interest rates and inflation expectations coincided with higher oil prices. We anticipate that rates will gradually decrease as disruptions in oil supply are resolved, likely boosting bond prices in the near future.
Lastly, the increase in oil prices has not been as severe as in 1990. Various factors are driving this.
- More diversified global supply in 2026.
- While ~23% of all seaborne oil travels through the Strait of Hormuz today, that number was closer to 30% in 1990.
- Market structures are more forward-looking (more investors trading for post-war outcomes)
- Stronger inventory management and strategic reserves
NSAG News
In March, Mark and Brian traveled to Miami for the Future Proof conference, the largest wealth management conference in the industry. Both Mark and Brian met with various leaders in fintech and asset management to discuss and share ideas on how to continue “future-proofing” North Star and better service clients in the AI era.
Also in March, Lisa returned from maternity leave following the birth of her second child, Lorenzo Luciano Saia. We are happy to say that everyone is doing well, and Lisa is now back in the office and actively servicing clients.
3/25/26 marked a major milestone as BGSU hosted its first Financial Planning Symposium and it exceeded even the loftiest expectations from both students and firms. With the support of the Charles Schwab Foundation, Mark Kangas has been the driving force in assisting BGSU to rapidly re-ignited its CFP program and is already on track to become the premier Financial Planning program in Ohio. In less than six months, enrollment has grown from 14 students to more than 200! Over 100 students and 25 different firms participated in March’s full day of learning, networking, and career exploration. March 25th didn’t happen overnight. The next Symposium is already scheduled for September 14, 2026 with an even larger number of students attending and we are honored to welcome an outstanding group of 50-75 firms who are willing to invest their time and talent in the next generation of financial planners.
Mark Kangas, CFP® BGSU CFP® Board, President & Founding Member BGSU grad: 2002, CFP®: 2004 (likely first CFP in BGSU’s CFP® program)
Pictured with Nick Stern ‘25 BGSU grad, Forrest Kuchling CFP® & ’22 BGSU grad, Claire Kallay ’25 BGSU grad

Where will the stock market go next?
On the last day of March, the market received an unconfirmed headline that Iran is now willing to negotiate an end to the conflict and a path to fully reopening the Strait of Hormuz. While this development sparked a broad rally across both stock and bond markets, we aren’t fully out of the woods yet. Iran has a splintered government structure which can make communications and agreements tougher to trust and confirm. Additionally, there is a possibility that future peace talks could collapse. So, in the near term, we expect continued volatility across global stock markets as the war in Iran progresses. As noted in the first section, war and conflict typically do not create a sustained drawdown for stock markets in the long run. A weakened Iran could actually lead to longer term benefits across global economies depending on how the dust settles.
Looking past the war, there are still some outstanding concerns that have acted as tailwinds to key sectors. Concerns over the private credit market have caused a pullback in financial stocks, and concerns over AI disruption have continued to be a headwind for software companies. While we have had a negative outlook on private credit, we don’t believe that the market size of this segment is large enough to send shocks across the financial sector broadly. Specific companies will be more exposed than others. In software, we think there are large portions of the sector that have built strong defensible models which insulate themselves from agentic AI’s disruptive nature.
In March, markets we’re broadly negative across geographies with non-U.S. stocks leading the pullback. The S&P 500 was down 5% while MSCI EAFE and MSCI Emerging Markets were down 10.2% and 13%, respectively. With that being said, non-U.S. stocks are still leading on a year-to-date basis. If we get meaningful progress in an Iran ware off-ramp, we expect non-U.S. stocks, particularly in Asian markets, to continue outperforming throughout 2026.
We are passionately devoted to our clients' families and portfolios. Contact us if you know somebody who would benefit from discovering the North Star difference, or if you just need a few minutes to talk. As a small business, our staff appreciates your continued trust and support.
Keep sending your questions for a chance to be featured in next month’s Timely Topics.
Best regards,


Mark Kangas, CFP®
CEO, Investment Advisor Representative


Brian Duffield, CFA®
Co-Portfolio Manager & Market Strategist