


Each month we ask clients to spend a few minutes reading through our newsletter with the goal of raising their investor IQ. December's edition of Timely Topics continues our dive into the comparison between today’s AI era and the dot-com era of the late 90s. This month, we are focusing on more targeted comparisons such as drawdowns, breadth, earnings growth, and valuations.
- Historical bull markets
- Drawdowns
- Market breadth
- Earnings growth
- Valuations & Euphoria
- Where will the stock market go next?
Historical bull markets
In November 2024, we summarized past bull market statistics in Timely Topics. Now, a year later, we've updated this table to compare trends and continue the discussion of the AI market era versus the dot-com era. Click HERE to see November 2024’s article.
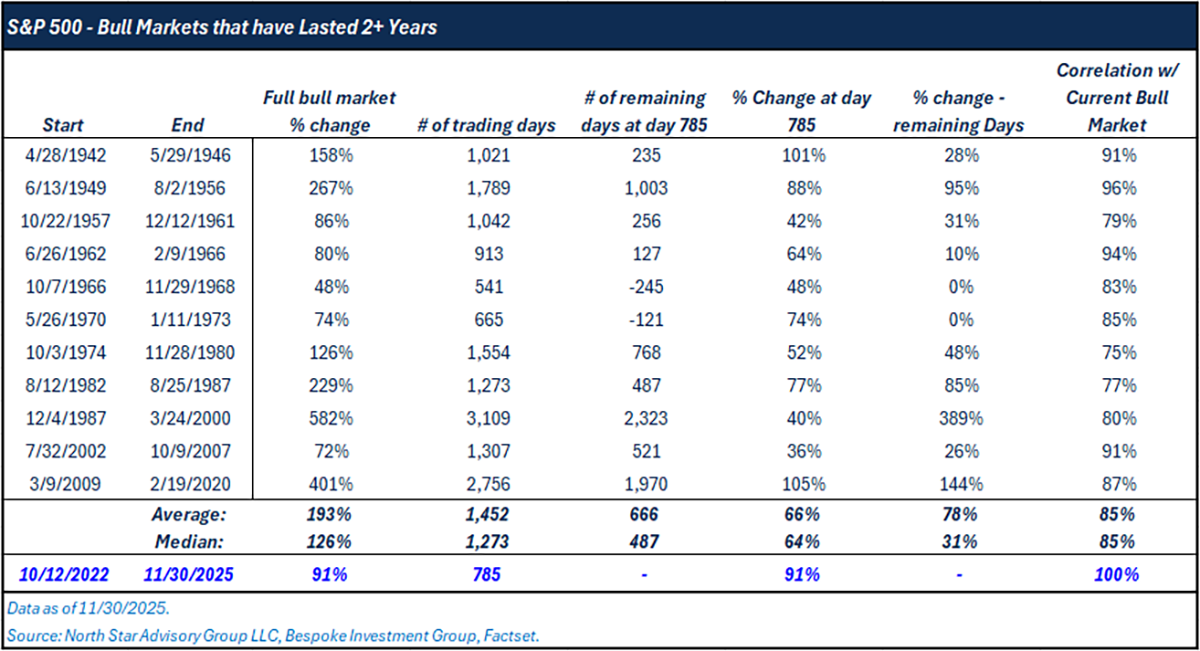
The current S&P 500 bull market that began in October 2022 has gained 87 percent over 785 trading days, which puts it well ahead of the typical pace of historical bull runs. Historically, bull markets that survived at least two years averaged a 193 percent total gain with a median of 126 percent, and they tended to unfold over much longer periods, averaging more than 1,400 trading days (~5.6 years). When you compare progress at the same point in time the difference becomes even more striking. On day 785 of past bull markets the average gain was 66% and the median was 64%. The current bull market had already returned 91% at that same milestone.
Overall, the data suggests that the present bull run has been stronger and faster than most of its historical predecessors. It broadly tracks past bull markets in shape given an average historical correlation of about 85%, but its magnitude has exceeded the midpoint of prior cycles. That combination of above average returns and a similar trajectory underscores both the momentum driving this cycle and the tendency for strong bull markets to follow recognizable patterns even when they advance at a quicker pace.
Drawdowns
Since the recent market top on 10/29/2025, the S&P 500 index fell 5.1% and the Nasdaq Composite Index is down 7.8%, although both indexes recovered a large portion of these losses in the back half of November. This pullback came right at the time where bubble concerns have captured the attention of investors and dominated news headlines. So this begs the question, “Is there a bubble bursting or is this normal market behavior?” To answer this, let’s compare drawdowns for these indices during the AI-era (past three years) and the first three years following Netscape’s IPO in 1995.
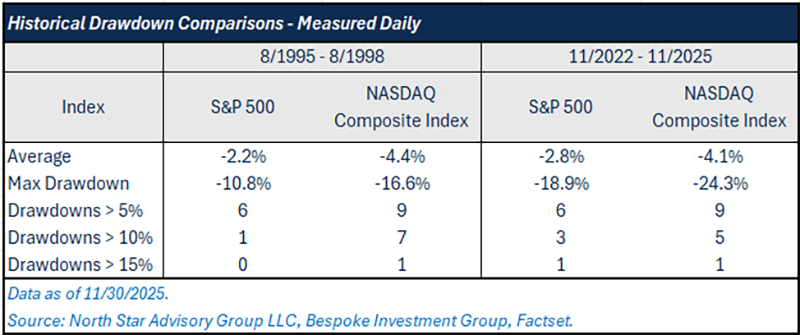
When you compare the first three years of the dot-com era to the first three years of the current AI driven cycle, the drawdown patterns show that the recent period has been only slightly more volatile but still broadly similar in structure. From 1995 to 1998 the S&P 500 experienced an average drawdown of 2.2% with a maximum pullback of 10.8% and six separate drops greater than 5%. The Nasdaq Composite was more volatile with an average drawdown of 4.4%, a maximum decline of 16.6% and nine drops greater than 5%. These figures capture the uneven rhythm of a market that was rapidly expanding while still subject to frequent sentiment swings.
2022 to 2025, the early AI era, displays almost the same pattern but with somewhat deeper lows. The S&P 500 posted an average drawdown of 2.8% and a maximum drop of 18.9% yet still recorded the same number of pullbacks greater than 5% as the late 90s version of the index. The Nasdaq Composite shows a similar profile with an average drawdown of 4.1%, a maximum decline of 24.3% and nine drops greater than 5%. The larger maximum drawdown of this era stems from the Trump Administration’s Tariff rollout. Taken together the data suggests that while the AI era has included sharper individual selloffs, the overall cadence of pullbacks is remarkably consistent with the dot-com period which reinforces the idea that powerful technology driven bull markets often share common behavioral traits even across very different economic backdrops. While the total index returns have been similar between both indices in each era, this era has had more volatility. This can actually be viewed as positive for the current era given that markets aren’t overly euphoric in comparison.
Market breadth
Market breadth has become one of the most important indicators for understanding the character of the current AI driven bull market. While headline indexes continue to post strong gains, the distribution of those returns across companies reveals how much of the advance is being driven by a select group of heavyweights versus the broader market. Comparing the performance gap between the market cap weighted and equal weight S&P 500 helps clarify how widespread participation has been and how this cycle lines up with the early years of the dot com boom.
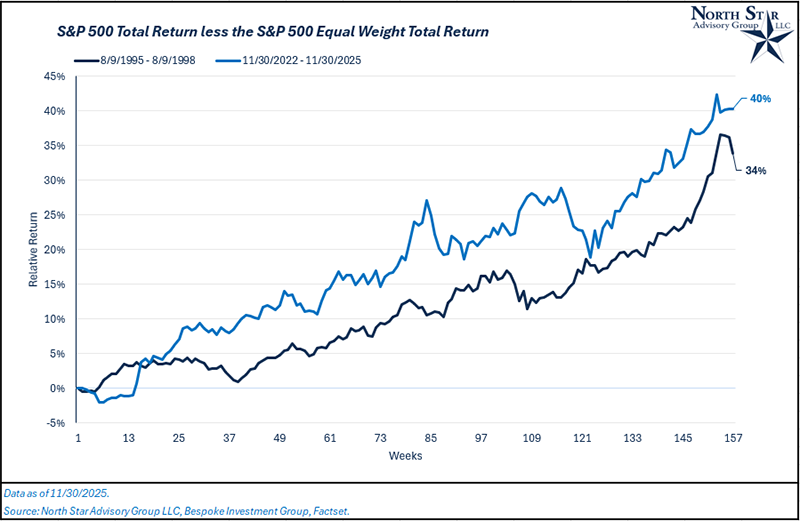
The latest data shows that the market cap weighted S&P 500 has outpaced its equal weight counterpart by about 40 percent over the first three years of this cycle. During the comparable period from 1995 to 1998 the spread was roughly 34 percent. Both eras saw steady gains from the highest weighted stocks with periods of faster divergence when mega cap leadership strengthened.
This pattern suggests that today’s rally has been heavily concentrated, but not too far outside of historical precedent. The largest companies have again carried a meaningful share of total returns, but the degree of dominance is only moderately higher than that of the late 1990s. Given the stronger profitability profiles for the largest companies in this era, higher concentration doesn’t come as a shock in comparison. What happens next will depend on whether earnings growth and investor interest broaden across more of the index or remain centered on a handful of leaders. Broader participation would give the market a healthier base for future gains while a continued tilt toward mega caps could leave the rally more vulnerable to leadership pauses and quicker more aggressive drawdowns.
Earnings growth
A key reason the market cap weighted S&P 500 has pulled so far ahead of its equal weight counterpart in this cycle is that the largest companies have delivered meaningfully stronger earnings growth. The chart shows cumulative EPS for the index rising nearly 40 percent from late 2022 through late 2025 while the equal weight version climbed only about 20 percent. That gap did not exist to the same degree in the dot-com era when many of the fastest rising stocks were still in early stages of monetization and profitability was often inconsistent or nonexistent. In contrast, today’s mega cap leaders have paired rapid revenue expansion with durable margins and large-scale cash generation which has allowed their earnings to compound far faster than the average company in the index. This stronger fundamental backdrop helps explain why market cap weighting has been so dominant in the current cycle and why the influence of the largest companies has been even more pronounced than during the tech boom of the late nineties.
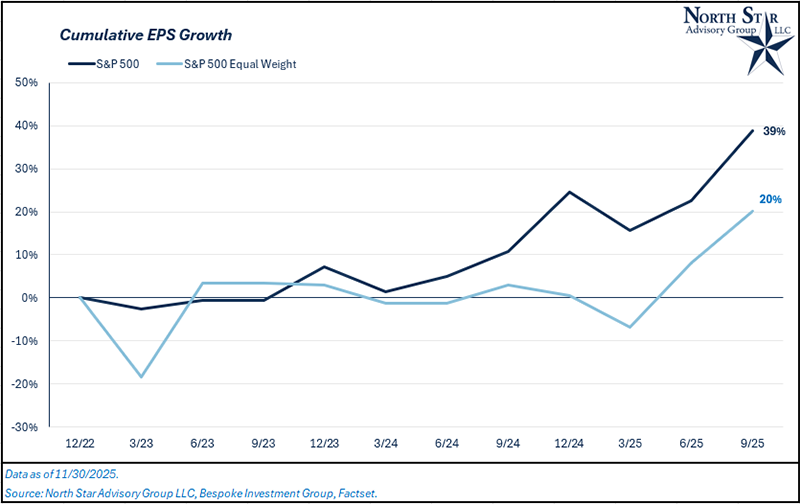
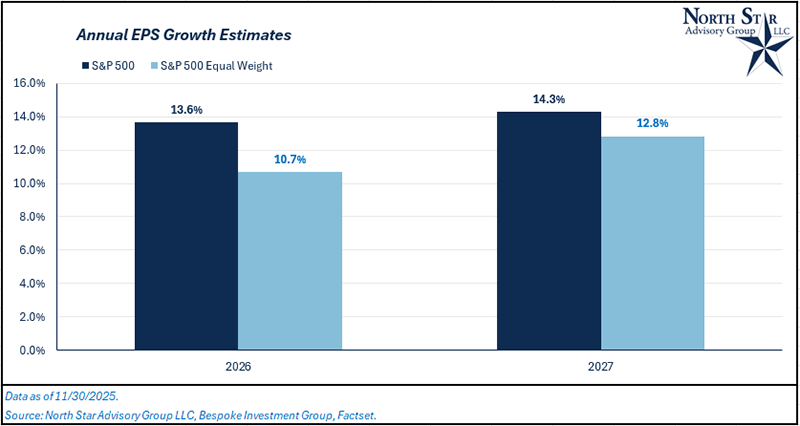
Looking ahead, the earnings advantage that has powered the market cap weighted S&P 500 is expected to continue, but the gap between large caps and the rest of the index begins to narrow. Estimates for 2026 and 2027 call for mid-teens EPS growth for the full index and low double digit growth for the equal weight version, which still reflects outperformance by the mega caps but by a smaller margin than in the past three years. This moderated spread ties directly to a growing conversation about the durability of mega-cap tech’s profitability. As the biggest AI beneficiaries continue to build out massive data center infrastructure their capital spending and depreciation expenses have risen significantly, creating uncertainty around how much of their current margins can be maintained. The next phase of this cycle may therefore hinge not only on whether smaller companies can accelerate growth but also on whether the largest AI players can keep expanding earnings at a pace that justifies their outsized influence on the index.
Valuation and Euphoria
As a final step, we turn to valuation levels and the broader sense of euphoria that characterized each cycle. While market narratives often focus on technology, innovation, or macro backdrops, it is ultimately investor sentiment and the willingness to pay ever-higher multiples that define the late stages of an equity boom. By comparing valuations, positioning, and behavioral markers across cycles, we can isolate what was truly unique versus what has consistently repeated. The data that follows will help quantify these dynamics and highlight how far exuberance has gone, how far valuations have stretched, and where today’s environment fits within that historical pattern.
The comparison of Nasdaq leadership in 1998 versus 2025 shows that valuations today are elevated but less extreme than during the dot-com era. In 1998 many of the largest companies traded at triple-digit earnings multiples while several had little or no profitability. The median trailing P/E for the group sat above 50x and the average exceeded 75x after excluding the negative outlier. Much of the index’s market cap rested on companies with unproven business models and rapidly rising investor expectations. By contrast the 2025 cohort consists mostly of mature, highly profitable mega cap platforms with durable cash flow. Their median P/E is lower and their average, while high, is skewed mainly by Tesla and Broadcom.
The composition shift matters. The dominant companies today have established revenue streams, recurring customer bases, and large margins that provide a cushion against cyclical slowdowns. Investors may still be paying a premium for growth, especially in areas tied to AI but the underlying fundamentals are stronger and more stable than the companies leading the index in 1998. Valuations may be rich, yet they are anchored by tangible earnings power rather than hopes for future profitability.

Digging one more level deeper, we looked at all stocks that were trading on the Nasdaq exchange (not just names included in the index), to look for signs of euphoria in each market cycle. In 1998 there were ~770 companies that had negative earnings, 120 companies that had a P/E ratio greater than 100x, and 58 companies with a P/E ratio greater than 200x. Compared to today, there is 470 companies trading on the Nasdaq with negative earnings, 83 companies with a P/E over 100x, and 38 companies with a P/E greater than 200x. Broadly, the dot-com era euphoria was more widespread across the market as seen through these stats.
Where will the stock market go next?
November began with markets adjusting to the late October trade truce, and although geopolitical noise persisted, investors quickly shifted attention back to fundamentals. The brief spike in tariff volatility around rare earths and semiconductor controls faded as both Washington and Beijing moved from confrontation to negotiation. This rapid de-escalation supports our view that the episode was tactical and not the start of a lasting conflict.
With policy fears easing, the market returned its focus to earnings and continued skepticism over the stocks benefiting from spending tied to AI infrastructure. The technology focused Nasdaq 100 fell 2.1% in November and the S&P 500 fell 0.5%. Small caps and U.S. Value markets showed relative strength versus technology as small caps were flat, and value stocks were positive by 2% in the month. These three areas of the market are less exposed to AI infrastructure spending.
Looking forward, we expect the main drivers of market direction to be earnings revisions, updates on U.S. and China communications, and the outlook for AI related capital spending.

We are passionately devoted to our clients' families and portfolios. Contact us if you know somebody who would benefit from discovering the North Star difference, or if you just need a few minutes to talk. As a small business, our staff appreciates your continued trust and support.
Keep sending your questions for a chance to be featured in next month’s Timely Topics.
Best regards,


Mark Kangas, CFP®
CEO, Investment Advisor Representative


Brian Duffield, CFA®
Co-Portfolio Manager & Market Strategist