


Each month we ask clients to spend a few minutes reading through our newsletter with the goal of raising their investor IQ. October's addition of Timely Topics covers different approaches to asset allocation, fed rate cuts, money market balances, and recent trends in consumer debt and delinquencies.
- Managing Stock and Bond Allocations
- Approach Example
- Buy bonds before rate cuts?
- Fed Cuts and Money Market Balances
- Consumer Delinquencies
- Where will the stock market go next?
Managing Stock and Bond Allocations
For this month, we thought it would be a good time to discuss another broad asset allocation topic. Similar to our recent article on asset location in August, this discussion will focus on broader themes related to the approach to building a client’s portfolio.
Every portfolio begins with a simple tradeoff: stocks tend to offer higher returns but more volatility, while bonds offer stability but lower growth. The right balance depends on an investor’s time horizon, risk tolerance, and income needs. For those with decades ahead of them, leaning heavily toward stocks can be a powerful strategy for wealth building, provided that the stock portfolio is diversified. Over the past 35 years, bonds have had an average annualized return of around 5% while global stocks have returned around 9.3%. Despite the fact that stocks experienced drawdowns of more than 22% in one day on 10/19/1987, 50% during the tech bubble, 50% during the global financial crisis, 30% during Covid, and 20% in 2022, the asset class still offered almost 2x the return than bonds over this time frame.
Bonds have an important role for many investors. They reduce portfolio volatility, provide income, and offer ballast during stock market downturns. For investors nearing or in retirement, bonds help smooth distributions and reduce the risk of being forced to sell stocks in a downturn. However, for younger investors or those with long horizons, allocating too much to bonds can meaningfully reduce the long-term growth of wealth. The role of stocks in a portfolio is to provide growth. Because stocks represent ownership in businesses, they capture the long-term growth of corporate earnings, innovation, population growth and productivity. Over time, this tends to make them the highest returning major asset class, significantly outpacing bonds or cash.
A common consideration in managed accounts is the perception of security that bonds offer. When clients request withdrawals, advisors typically liquidate assets on a pro-rata basis across all investments. Consequently, although bonds are included to mitigate overall portfolio volatility, stocks may still be sold during market downturns when raising funds, which can further impact long-term stock holdings.
Now that we know the role of stocks and bonds in a portfolio, how should we decide how much an investor should own of each? Below, we’ve explained three of the more frequently used asset allocation approaches:
- The questionnaire approach is the most traditional method of building a portfolio. Investors answer questions about their risk tolerance, investment goals, time horizon, and financial situation. The answers are then mapped to a “model portfolio” with a certain mix of stocks and bonds. For example, a conservative investor may be matched to a 40 percent stock and 60 percent bond portfolio, while an aggressive investor may be placed in 90 percent stocks and 10 percent bonds. During the accumulation phase, these allocations tend to remain fairly static, meaning the investor’s stock exposure doesn’t change much over time unless they retake the questionnaire or update their preferences. In the distribution phase, retirees may shift to more bonds, but the process is usually ad hoc rather than built into the design. This approach is flawed as investors tend to answer that they want to be aggressive after the market has run and they want to be conservative after the market has fallen. Their emotion is skewing their allocation in the wrong direction at pivotal times in market cycles.
- Target date funds use a preset glidepath to adjust the stock to bond mix automatically as the investor ages. A young investor in a 2065 fund might start with 90 percent in stocks and 10 percent in bonds. Over the decades, the fund gradually reduces stock exposure and increases bond holdings. By the time retirement arrives, the portfolio may be closer to 40 or 50 percent stocks, with the rest in bonds. The idea is to maximize growth during the accumulation phase and steadily de-risk as retirement (the distribution phase) approaches. This approach is simple and hands-off, but the tradeoff is that the allocation is based only on age, not on the individual investor’s unique circumstances or spending needs and generally, an investor finds themselves too exposed to bonds during all stages of their life.
- Liability matching takes a more customized approach. Instead of allocating to stocks and bonds based on age or a risk profile, bonds are purchased to match known future expenses, or “liabilities.” For example, if a retiree knows they will need $50,000 per year for the first 5 years of retirement, they might build a ladder of high-quality bonds maturing each year to cover those expenses. During the accumulation phase, the portfolio may remain almost entirely in stocks to maximize long-term growth, since cash flow needs are far off in the future. As retirement begins, bonds are added specifically to fund the years when withdrawals will be required, while the remainder of the portfolio stays in stocks to continue compounding. This creates a direct link between bond allocation and actual spending needs, rather than relying on rules of thumb or preset glidepaths. This approach involves dividing a portfolio into two segments: one to cover distributions over the next five years, and another intended for growth to address expenses and inflation over the following 20+ years. NSAG generally utilizes this strategy for its clients.
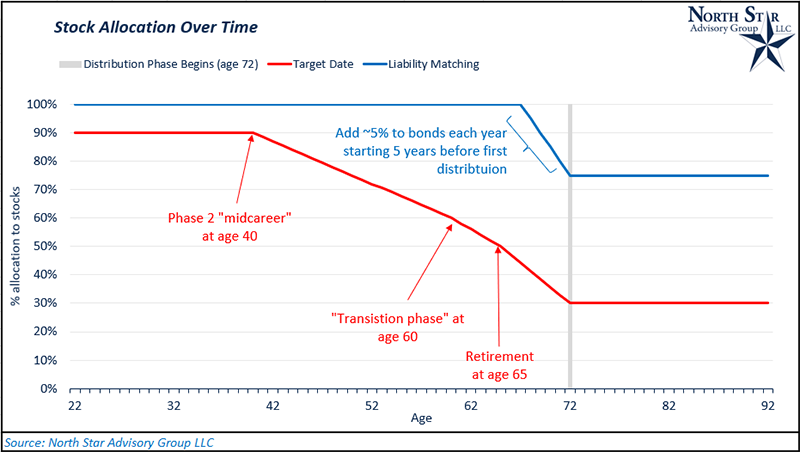
In the next section, we will model out hypothetical growth for two portfolios. One will use a liability matching approach and the other will use the target date approach. Before we begin modeling out the numbers, we’ve provided an example below of how the stock allocation changes over time for each.
Approach Example
As we can tell from the previous section, a target date approach will generally lead to an investor having a much larger allocation to bonds at all points in time relative to a liability matching approach. As mentioned previously, stocks tend to outperform bonds handedly over long periods of time despite the added risk and volatility associated with the asset class. To illustrate the differing impact that these two approaches can have on total portfolio value over time, we’ve modeled out a hypothetical scenario for an investor starting at age 22 that utilizes a target date approach compared to an identical investor utilizing a liability matching approach.
To set up this example, we used the following assumptions:
- Both investors start at age 22.
- Both investors contribute $10,000 to their portfolio at the beginning of each year through age 65.
- *From age 72 through 92, both investors withdrawal 5% of their accounts in the beginning of each year.
- Stocks earn an average annual return of 9.3% (35-year historical average).
- Bonds earn an average annual return of 5.0% (35-year historical average).
*NSAG has found that families who properly save for retirement distribute around 2-8% of their portfolio per year in retirement, with the average coming in around 5%. Families that have not properly funded retirement will need to spend a higher percentage of their retirement, resulting in them spending down their retirement savings at a faster rate.
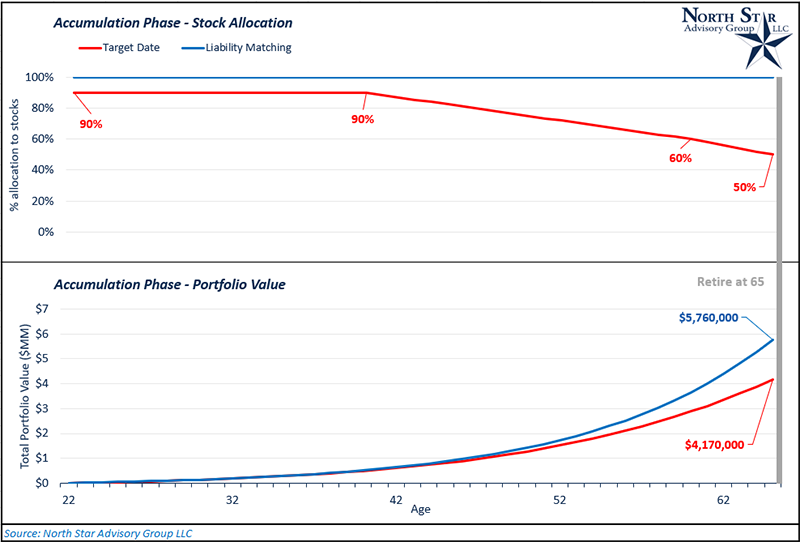
In the chart below, we’ve started by illustrating the allocations and portfolio growth for each investor during the accumulation phase (age 22 – 65). The liability matching investor had an average bond allocation of 0% throughout these years, while the target date investor’s average bond allocation was ~21%. The liability matched investor generated ~$1.6 million more in value during this phase.
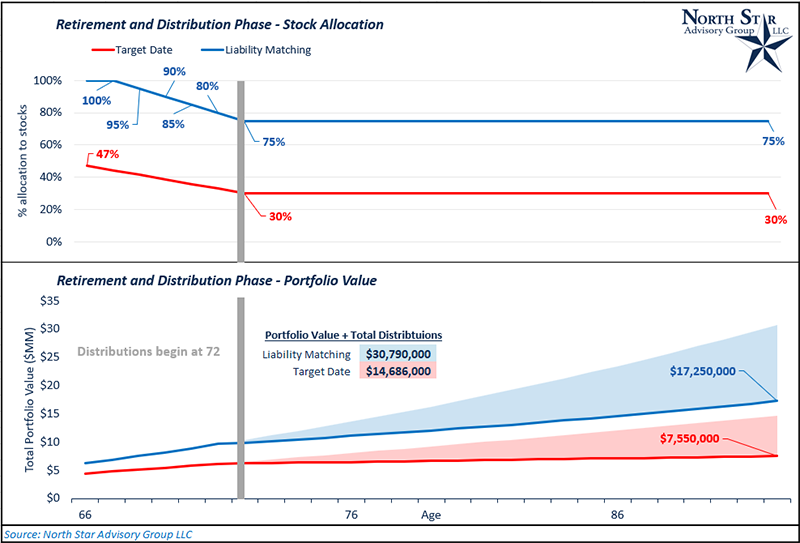
In retirement and pre-distribution (age 65 through 71), the liability matched investor continues to earn a higher annual rate of return as smaller portions of the portfolio are shifted into bonds in preparation for distributions (age 72 and beyond). After age 72, the liability matched portfolio’s bond allocation remains right around 25% (covering 5 years of 5% withdrawals). On the other hand, the target date portfolio has 70% bonds in perpetuity. Over the full 70-year period, overallocation to bonds in the target date portfolio generated a total market value headwind of just under $10 million. On top of the difference between ending portfolio values, each portfolio has been withdrawing 5% annually for 20 years. The target date portfolio generated cumulative distributions of $7.13 million over 20 years while the liability matched portfolio generated $13.5 million in cumulative distributions.
Buy bonds before rate cuts?
Many clients may have noticed that we have now been recommending short duration bonds in their fixed income portfolios over the past 12+ months. Short duration bonds are usually classified as a bond with maturities between 1-3 years. These bonds can be treasuries, corporate bonds, mortgage-backed securities, etc.
The reason behind this recommendation was due to two primary factors. One being the shape of the yield curve at the time, and the other being the Federal Reserve’s expected interest rate movements. We had just gone through a period of interest rate hikes in 2022, and this caused the yield curve to be “inverted”. An inverted yield curve refers to a market where the yields on short duration bonds are greater than the yield on long duration bonds. While the market speculated when rate cuts would happen, there was little doubt that they would happen eventually. In this environment, it made sense to grab higher yields on the shorter end of the curve while also reducing interest rate risk (reducing duration) and owning a security that would be most influenced by Federal Reserve actions.
It’s easy to think of Fed moves in simple terms: if the Fed cuts rates, all interest rates must go down; if the Fed hikes, everything goes up. But in reality, the story is more nuanced. Treasury yields across different maturities don’t always move in lockstep with the Fed’s decision. Instead, each part of the yield curve reacts in its own way, reflecting not just today’s policy but also the market’s expectations for the future. Short term treasury yields are the most sensitive to Fed moves. A rate hike usually pushes short-term yields higher almost immediately, since investors expect short-term borrowing costs to rise. On the flip side, when the Fed cuts rates, short-term yields typically fall in step. Longer maturities respond less directly to Fed policy. Instead, they reflect expectations for the economy, inflation, and growth over time. For example, if the Fed cuts rates to stimulate growth but investors worry about long-term inflation, 10-year or 30-year yields might not fall as much and sometimes they can even rise.
Looking at the last 35 years, the evidence is in the data table below.
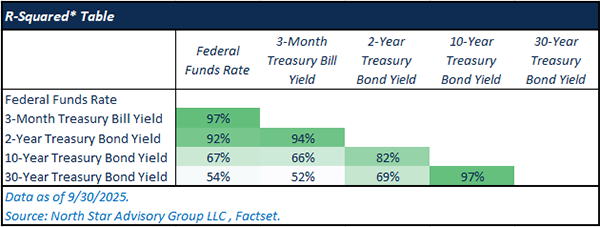
*R-squared refers to the % of variance in the dependent variable explained by the independent (Federal Funds Rate). For example, the Federal Funds rate only explains 67% of the total variance in 10-year treasury bond yields.
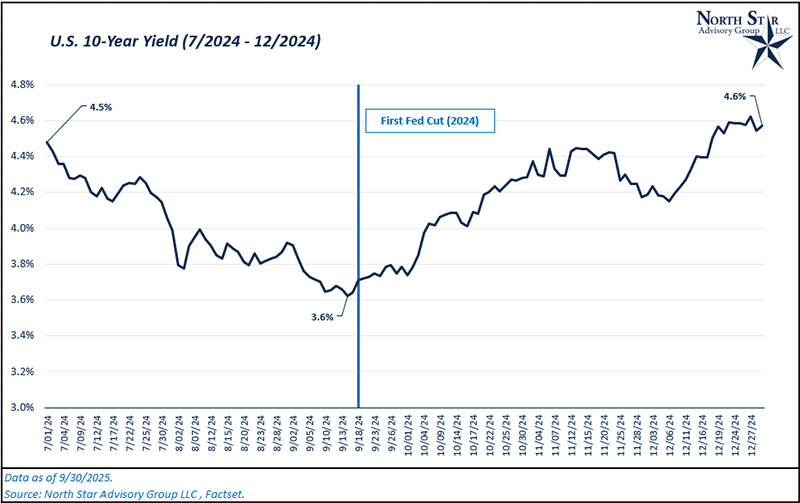
Additionally, fed cuts (and hikes) are typically telegraphed well by the committee, and the market will generally price these actions into market rates prior to the actual event. We saw a perfect example of this prior to the Fed’s first cut in September of last year. The 10-year rate fell sharply over the summer from 4.5% in July to 3.6% in mid-September. Following the Fed’s cut, this yield level rose sharply from 3.6% back to ~4.6%.
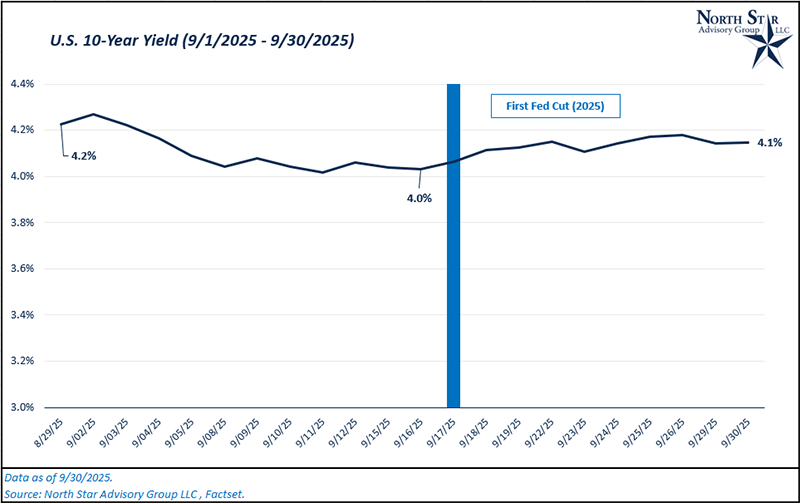
Over the past year, short duration bonds have had returns ~4.5% while longer term bonds have had returns ~3.7%. As of 9/30/2025, the yield curve has flattened out a bit (relative to where it was one year ago today). Short duration treasury rates are hovering ~3.8% while longer term treasury rates are at ~4.1%. So, today’s environment isn’t as attractive (relative to one year ago), but there is still concern over longer term rates moving higher despite interest rate cuts due to fiscal deficits, federal debt levels, and volatile trade policies. These concerns lead us to continue favoring short duration in client portfolios.
As expected, the Fed cut rates by a quarter point on 9/17/2025. Additionally, they signaled two more rate cuts in 2025 and only one rate cut in 2026. Since 9/17, the 10-year yield has moved up ~10 bps to 4.15%%. While it is not as drastic as last year’s move, we are seeing a similar trend with long-term rates moving higher following a rate cut.
Fed Cuts and Money Market Balances
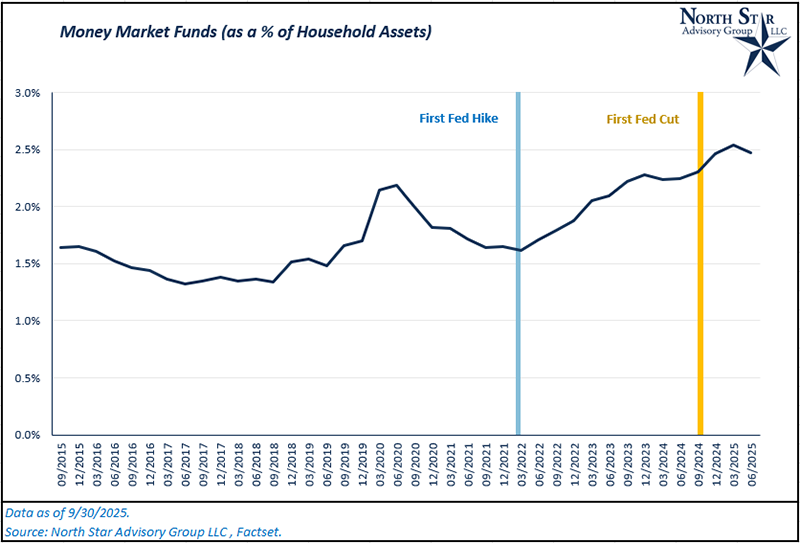
Household money market holdings have grown significantly over the past decade, both in absolute dollar terms and relative to overall household assets. In the early 2000s money market funds were a relatively small slice of household portfolios. After the global financial crisis their importance declined further, as near-zero interest rates left yields negligible. But in the past two years, rising short-term rates have made money market funds more attractive. Just over $4.8 trillion in the U.S. now sit in these vehicles, representing a higher share of household assets than we have seen in decades.
Several forces explain this trend:
- Higher yields: After years of near-zero interest rates, households can now earn around four percent in money market funds with daily liquidity. That combination is compelling relative to traditional checking and savings accounts.
- Risk aversion: Market volatility and uncertainty about the economy have made households more cautious, encouraging them to keep more assets in highly liquid, low-risk vehicles.
- Banking dynamics: Regional bank stresses in 2023 pushed many households to move funds out of bank deposits and into money market funds perceived as safer and better yielding.
- Technology and access: Money market funds are easier than ever to access through brokerage accounts and digital platforms, lowering the frictions to entry.
Higher yields have been the most significant force, driving increased investor interest in money market funds. Total money market balances have grown by ~74% since December 2021. Over the same time frame, total household assets have only grown by ~16%. Clearly, households are taking advantage of the current interest rate regime, and this includes NSAG’s clients.
On the positive side, clients have finally been earning a return on cash for the past couple of years. This has helped to strengthen household finances, especially for savers who endured years of negligible interest income. However, there are trade-offs. A large allocation to money markets provides safety, but it also means less participation in the long-term growth of stocks or other risky assets. Over time, overweight cash positions can dampen wealth accumulation.
At the market level, elevated household cash balances act as both a buffer and a potential source of fuel. On one hand, high money market balances reflect a degree of caution that may restrain risk-taking. On the other hand, those balances represent dry powder. If confidence continues to improve, some of these funds may rotate into stocks or bonds, supporting asset prices.
Consumer Delinquencies
Over the last year household credit performance has been moving in an uncomfortable direction. After a long run of historically low delinquency and charge off rates following the pandemic shock and government policy support, several categories of consumer credit are showing renewed stress. The shift is not uniform across debt types. Auto loan and credit card delinquencies have climbed noticeably, while student loan delinquencies have surged as federal repayment pauses ended and reporting resumed. These trends matter because higher delinquencies can reduce household spending, increase bank losses, and alter financial system risk dynamics. The rest of this article explains where delinquency rates stand today, how current trends compare with the last twenty years, how balances have grown relative to household assets, and what the likely macro and market implications could be.
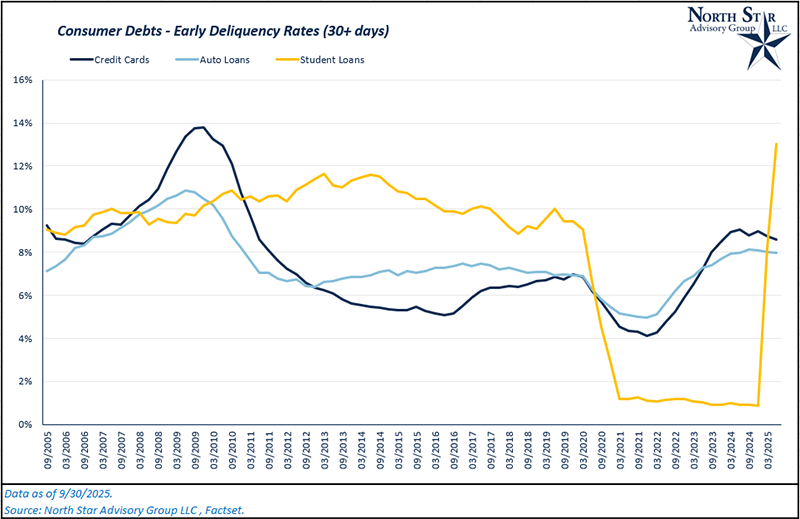
The chart below presents early delinquency rates for consumer credit cards, auto loans, and student loans. Since December 2021, credit card delinquency rates have increased from 4.1% to 8.6%, while auto loan delinquencies have risen from 5% to 8% over the same period. Both categories have experienced a consistent increase, reaching levels above those observed prior to the pandemic in 2019. However, delinquencies appear to have peaked in June 2024 and have since stabilized over the past twelve months. With the transition to a new administration in 2025 and the conclusion of student loan payment pauses, student loan delinquencies have also rebounded, placing additional strain on U.S. consumers. Student loan delinquency rates have reached twenty-year highs at approximately 13%. It is possible that, as consumers adjust to the resumption of payments, these delinquency rates will decline as spending and savings behaviors adapt.
When looking at consumer debt in nominal dollars, credit card balances have experienced the sharpest increase following the pandemic. Aggregate credit card balances are up ~41% since December 2021. Over this same time frame, household assets have risen by 16%. Student loan balances are up only 4% and auto loan balances are up by 13.5%.
Considering historical averages and the recency of the student loan data, we don’t find the overall uptick in delinquencies to be alarming. Keep in mind that these delinquency rates are based on any late payments that are greater than 30 days. The 90-day delinquency rate on student loans is ~11%. Auto loan and credit card delinquency rates are at 5% and 10%, respectively based on the 90-day late period. Although, we will be keeping a close eye on these levels. Remember, around 70% of U.S. GDP comes from consumer spending, so any sign of stress on the consumer should be evaluated.
Where will the stock market go next?
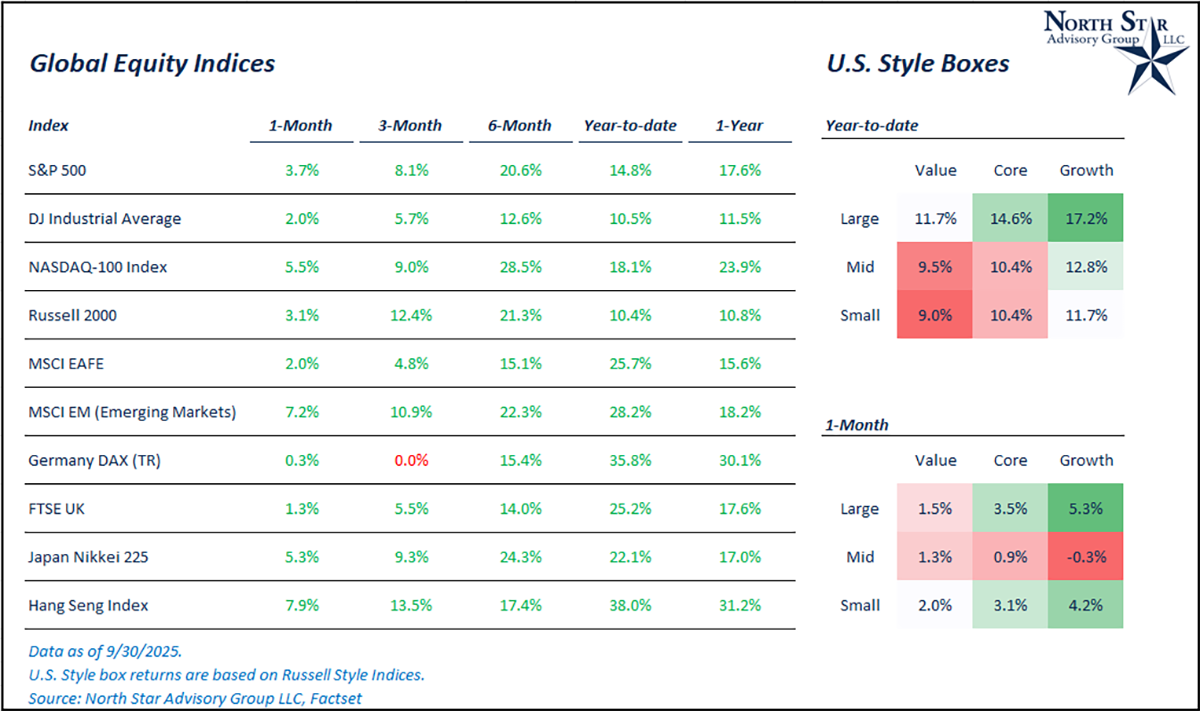
Last month, we discussed our continued view of continued positive returns for the U.S. market, albeit with higher volatility and at lower than historical average levels. For the month of September, we saw the S&P 500 index gain another 3.7%, bringing the year-to-date total to 14.8%. This month, the U.S. large cap market was led by mega-cap tech companies. The Nasdaq 100 index gained 5.5% for the month, and the Dow Jones Industrial Average gained 2%. Most of the large cap gain this month was driven by continued valuation expansion. During September, the Russell 2000 (small cap index) gained 3.1%, keeping pace with large cap stocks.
Bringing non-U.S. markets into the conversation, emerging markets stocks gained 7.2% during the month, making this the best performing major market segment for September and 2025 through three quarters. On a year-to-date basis, the MSCI Emerging Markets Index and MSCI EAFE Index have gained 28% and 25%, respectively, continuing to outpace U.S. markets.
This month, the Federal Reserve resumed its rate-cutting cycle, lowering the federal funds rate by 0.25% on 9/17/2025 and indicating the potential for two more cuts this year. The committee is balancing weaker job numbers against strong GDP growth in its meeting-by-meeting decisions, resulting in ongoing interest rate volatility due to conflicting economic data. Jerome Powell noted that current rates are slightly restrictive, suggesting a committee focus on growth and inflation rather than weaker jobs data. As more rate cuts occur, small cap stocks may benefit due to their reliance on short-term floating-rate debt.
We continue to encourage diversification in our client’s stock portfolios and cautioning against large overweight positions in U.S. large cap stocks. Non-U.S. large cap segments (international, small cap, etc.) have lower valuation profiles with similar earnings growth prospects in many cases, leading to an overall more attractive long term set up for these segments.
We are passionately devoted to our clients' families and portfolios. Contact us if you know somebody who would benefit from discovering the North Star difference, or if you just need a few minutes to talk. As a small business, our staff appreciates your continued trust and support.
Keep sending your questions for a chance to be featured in next month’s Timely Topics.
Best regards,


Mark Kangas, CFP®
CEO, Investment Advisor Representative


Brian Duffield, CFA®
Co-Portfolio Manager & Market Strategist