


Each month we ask clients to spend a few minutes reading through our newsletter with the goal of raising their investor IQ. July's edition of Timely Topics examines the latest trends observed in U.S. employment and consumer trends, the differences in defense spending trends between Europe and the U.S., and the potential impact another middle eastern conflict may have on the oil markets.
- Freedom isn’t free
- Oil markets and the Middle East
- Hard economic data
- Employment
- Consumer spending
- Where will the stock market go next?
Freedom isn’t free
Following last month’s discussion of the “One big, beautiful bill” and with Fourth of July celebrations coming up, we would like to provide clients with an update on U.S. defense spending and how recent developments may influence future spending patterns.
Reviewing recent years, the total dollar amount allocated to defense has increased consistently year over year. From 2015 to 2024, this number grew at a compound annual growth rate (CAGR) of 3.9%. Although, according to the Congressional Budget Office (CBO), the growth rate in defense spending is projected to slow to 1.4% per year over the next four years, as illustrated in the first chart. Additionally, it is noted that post-Covid, the defense budget has decreased relative to all other government spending categories in aggregate. From 2019 to 2024, the percentage of total spending that went to defense has dropped from 15% to 12%. Defense spending has not decreased from a dollar perspective but spending in all other categories has increased at a much faster rate post-Covid.
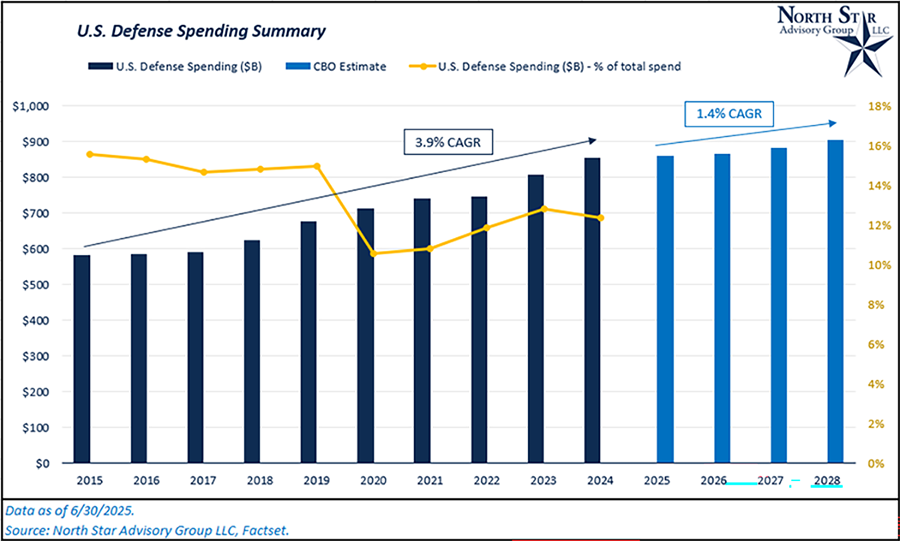
It’s likely that the CBO is not yet factoring in the “One big, beautiful bill” into its current projections. This bill would authorize an additional $150 billion towards defense spending in 2025. Looking at 2025’s projection of $859 billion relative to $855 billion in 2024, it’s clear that the probability of the bill passing is not yet baked into the projections. The slowing growth in defense is likely coming from expectations of less support for the Ukraine as this administration has been much more dovish towards funding continued war in the country. This dovishness was on display a few months ago as tempers flared during Zelensky’s visit to the White House. Assuming the new budget is passed, we may see the decreases of defense spending towards Ukraine be offset by spending on defense within U.S. borders, bringing the growth rate projections back to historical norms. Trump has floated the idea of a “Golden Dome” mimicking Israel’s Iron Dome missile defense system, but a lot of the new potential spending will likely go towards drones, software, and the development of next-gen technologies.
Note: While writing this section, NATO allies agreed to a new defense spending target of 5%. Only 3.5% needs to be spent on pure defense while the remaining 1.5% is targeted to be spent on security and critical infrastructure. As of 2024, the U.S. already spends ~3% of GDP on pure defense, so the spending jump to meet this new criteria will not be as large as expected across other NATO nations.
European nations, particularly Germany, announced large defense spending packages to support not only Ukraine but Europe as a whole in response to the U.S. administration’s dovishness towards the Ukraine/Russia conflict. Germany’s package includes an $11+ billion increase (or +22% y/y) and an amendment to their constitution allowing for defense spending above 1% of GDP. France and the U.K.’s defense increases aren’t as large as Germany’s, but still strong at 7% and 11% y/y, respectively. In comparison to the U.S., Germany and France have both been allocating ~12-13% of total government expenditures towards defense in recent years while the U.K. trails all three at just ~6%.
Even if we factor in the “One big, beautiful bill,” it’s likely that European defense spending will grow at a faster pace than the U.S. over the next few years. This spending in Europe could have a larger impact on their domestic stocks than increases in U.S. defense spending would have on our domestic stock market. The S&P 500 has an allocation of just 2% to aerospace and defense companies and 7.8% to broader industrials. The Stoxx Europe 600 Index has a 5% allocation to aerospace and defense and an overall allocation of 18% to broader industrials.
Note: The STOXX Europe 600 is a stock index that represents the performance of 600 large, mid- and small-capitalization companies from 17 European countries.
Oil markets and the Middle East
With another war breaking out in the oil-rich Middle Eastern region of the globe, this time between Israel and Iran, we want to provide an update on what this conflict could potentially mean for our clients’ portfolios. The sector that would be most immediately impacted by this conflict is, to no one’s surprise, the energy market. From 6/12/2025 through 6/30/2025, WTI crude oil is down 2% despite the volatility in the region. In the immediate aftermath of Israel’s first airstrike, WTI crude oil popped 7.3% on 6/13/2025. Oil then increased by another 3% over the next week through 6/20/2025. Over the following weekend, U.S. B-2 bombers took out three nuclear enrichment sights in Iran. According to most media outlets, this operation rendered each sight useless and in response, Iran launched missiles at a U.S. military base in Qatar. Although, this proved to be a symbolic retaliation and marked the beginning of a ceasefire between Israel and Iran. Since this point, oil has fallen 12% (6/20 – 6/30) and is trading below the price prior to the “12-Day War”.
While cooled for now, tensions in the Middle East could easily ignite again. So, lets analyze the potential impact a reignited conflict with Iran could have on the oil markets? To answer this, we can refer to recent geopolitical events for comparison. Specifically, we will examine the energy market’s reaction following Russia’s invasion of Ukraine in 2022. On February 23, 2022, WTI crude oil was trading at approximately $92 per barrel. The day after Russia invaded Ukraine, oil prices increased to $101 per barrel (+9.7%) at their peak but settled around $93 per barrel. Prices didn’t reach their peak of $130 per barrel until March 7, 2022, a 42% increase from pre-invasion prices, although this spike was short-lived. This event significantly impacted the market as Russia was responsible for about 11% of global oil production. Notably, oil prices were already elevated in early 2022 due to supply shocks from the economic recovery following the Covid-19 pandemic in 2021.
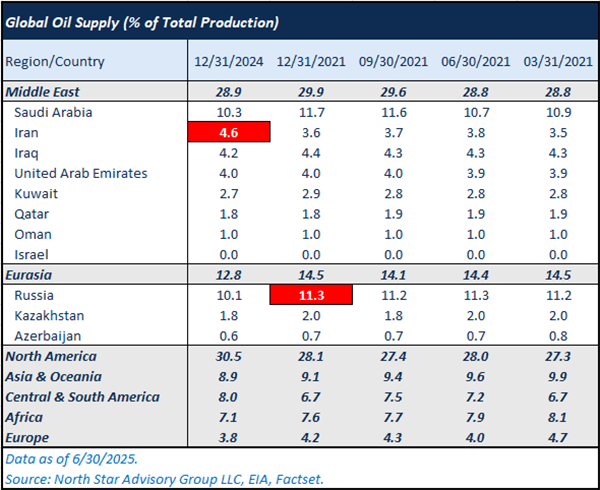
By proportionately comparing the sanctioned nations' oil supply levels (11% for Russia and 4.6% for Iran), we might anticipate around 40% of the shock experienced in 2022. Based on this proportional analysis, oil prices could potentially reach $80 per barrel, or a 17% increase from the price just before Israel’s initial airstrike.
Keep in mind that before Russia invaded Ukraine, the sanctions on the country were somewhat limited in scope, and the harsh sanctions that followed were considered to be “new news” to the market, causing the price spike. In comparison to the current conflict in Iran, the U.S. has already been imposing heavy sanctions on Iran for years, and this factor has already been priced into oil. If we were to see a 2022-style shock to energy markets, the conflict would have to spill into neighboring Middle Eastern nations, Saudi Arabia in particular, as they are the largest producer in the region at 10.3%. Any attempted closure of the Strait of Hormuz could reignite volatility into the energy markets as well. The U.S. would be less affected by any potential closure given that only ~10% of our oil imports come through the strait (Unlike China who imports 90% of their total imports through the strait). Overall, we do not expect a global oil shock from this conflict, nor a near-term spike in gas prices or inflation.
Hard economic data
Last month we wrote about consumer sentiment and the distinction between soft economic data and hard economic data. Some examples of soft economic data include consumer confidence surveys, business outlook surveys, purchasing manager’s index (PMI), etc. Hard economic data refers to actual tangible results in the economy, such as employment, retail sales, industrial production, inflation, etc.
On June 10, Jamie Dimon, CEO of J.P. Morgan Chase, spoke at a Morgan Stanley Conference and was quoted saying, “I think there’s a chance real numbers will deteriorate soon,” and downplaying the soft economic data (discussed last month) he also said, “neither consumers nor businesses ever pick the inflection points, but the economy’s soft landing was likely to look weaker going forward.”
Jamie has been the CEO of J.P. Morgan since 2006, and he’s become infamous on the street over the years for continuing to make bearish warnings. You may recall in late May of 2022; Jamie warned of an “economic hurricane” on the horizon. Through 6/30/25, the S&P 500 is up +56% since Jamie’s economic hurricane warning. The success he’s had as a CEO has not followed him into his broader economic predictions.
As noted in last month’s Timely Topics, hard economic data continues to be strong despite various macro-economic and geopolitical concerns looming such as tariffs, Russia-Ukraine, Middle Eastern tensions, and U.S. fiscal budgetary concerns. As we mentioned, hard economic continues to be resilient and this can be seen in the summary table below. Nevertheless, we will dig below the surface values of a few of these data series in each of the next sections to see if we can spot any warning signs that may warrant Jamie’s concerns.
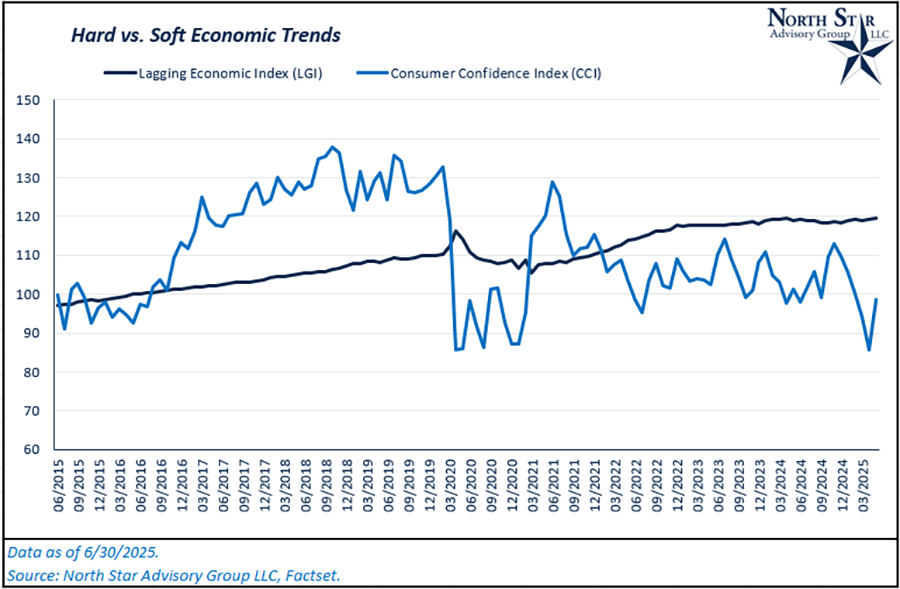
In the past six months, the Consumer Confidence Index (CCI) has been down ~13% (a soft economic indicator) while the LGI has remained solid and is up by 0.8% over the past six months as of the end of May. The LGI refers to a composite of 7 lagging hard economic data points. From a high level, this chart illustrates the contrast we made between soft and hard economic date last month, and shows that so far, hard data has remained resilient. You’ll also notice the much higher volatility in CCI over time as it is a subjective metric. In the next two sections, we’ll peel back the layers on recent employment data and consumer spending data to see if we can find anything that may warrant Jamie’s warning.
Employment
As we dive deeper into the recent data, we’ll start by taking a closer look at the Bureau of Labor Statistics’ (BLS) private non-farm payroll report. As of 5/30/2025, there are currently ~135.9 million citizens on payroll in the private sector, which is up by an annualized rate of 1.2% over the past six months, or +873k. This is ahead of the 20-year CAGR of 1%.
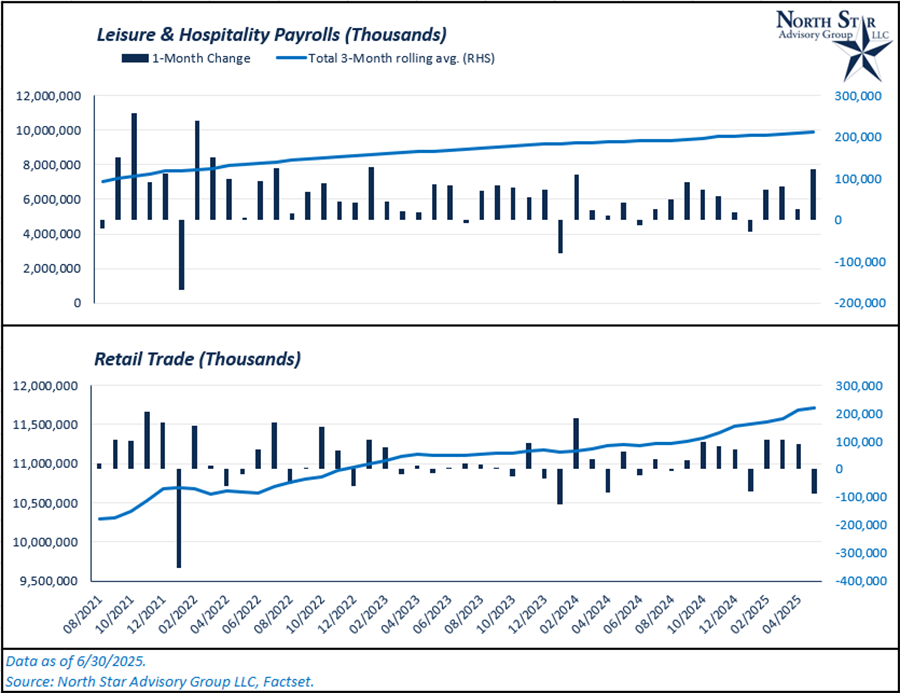
Historically, retail trade and leisure and hospitality jobs are the first to see cuts when economic conditions worsen behind the scenes. This is caused by the fact that spending is primarily discretionary in these areas. Deteriorating job growth in these areas could act as an economic warnings sign. So, do we see any cracks in either of these categories? Of the 873k payroll additions over the past six months, 121k came from leisure and hospitality (L&H), and 73k from the retail sector, both of which are higher than historical growth trends. Retail trade did lose ~88k payrolls in May, but you’ll notice in the chart below that retail trade tends to be volatile on a month-over-month basis. This monthly decline came in response to tariff uncertainty, which greatly impacts the retail sector. As long as trade deals continue to progress and the liberation day tariff rates remain on the sidelines; we don’t expect a prolonged shock to retail trade employment or overall private payrolls in general.
Turning to the public sector, there are currently 23.6 million people employed in government at federal, state, and local levels. In the past six months, federal employment has dropped by 53k, but overall government employment has risen by 69k. The decline at the federal level was negated by a 97k increase in local government employees and a 25k rise in state employees. Despite concerns about federal employment declines due to spending cuts or DOGE operations, federal workers only make up 1.8% of total employment. Therefore, we do not expect significant impacts on the overall economy, even if declines persist in the coming months.
Consumer spending
Consumption over the past six months has been positive but slightly weaker than historical averages as measured by the BEA’s Personal Consumption Expenditure (PCE) report. As of May, PCE has risen at an annualized rate of 3.5% over the past 6 months in nominal terms. This is lower than the 20-year CAGR of 4.4%. In the past month (May over April), the annualized rate slowed to 2.8%.
While this deceleration in spending should be noted, we don’t view it as a red flag when digging deeper into the report. Let’s examine the trends in the most discretionary items, such as clothing, dining out, and luxury goods. These categories are typically the first areas consumers pause spending if they are concerned about their future employment and potential economic stress. Major purchases also take a pause (homes, cars, and furniture).
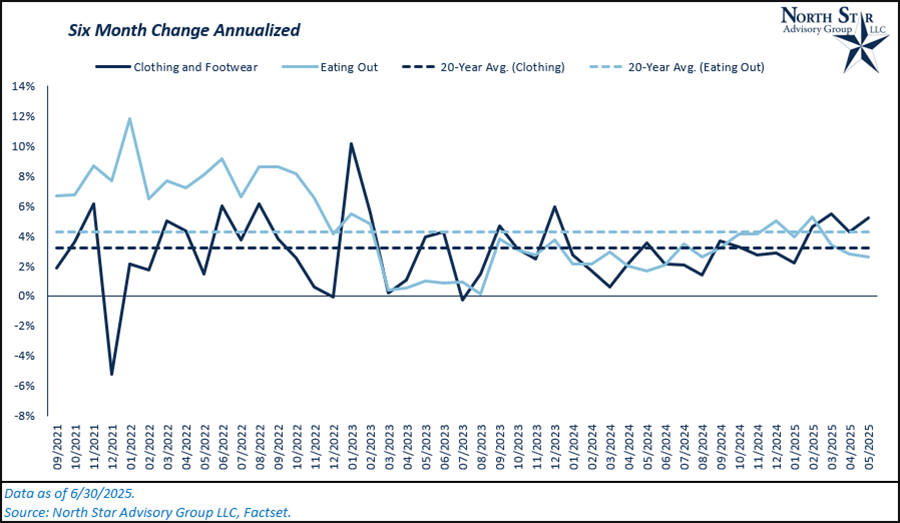
Clothing and footwear grew at an annual rate of 5.2% over the past six months, stronger than the historical average. Although, this category has experienced some volatility on a month-over-month basis. In May, spending in this category was up by 1% versus April and April’s spending was down by 0.4% versus March. While this category’s numbers have been volatile (but strong) in 2025, they deserve a bit of added context. Clothing and footwear are products that are almost exclusively imported from the Asian-Pacific region (China, Vietnam, etc.), so consumers pulled their purchases forward in March ahead of April 2nd’s Liberation Day. With increased spending in March, it made sense to see a pullback in April, and the decline of 0.4% was actually better than we expected. As noted, this one-month spending pause was then followed by strong growth in May (+1% month-over-month). So far, there are no meaningful cracks in this category.
Autos saw a similar pull forward in March as many components of a vehicle are imported (+10% month over month in March). Although, auto spending continued to grow in April (+1.6% month over month), unlike the trend we experienced with clothing. Spending on this category finally saw a pause in May (-6% month over month). We don’t view this as concerning given the strong growth in the previous two months, the fact that the category is more volatile in general, and there are other major influences on this spending, such as interest rate levels.
Lastly, spending on eating out has risen at an annualized rate of 2.5% over the past six months, with a slight declines of ~0.1% in each of the past two months. Despite growth in this category being below historical averages, as of May, we aren’t seeing a collapse in this category either.
Where will the stock market go next?
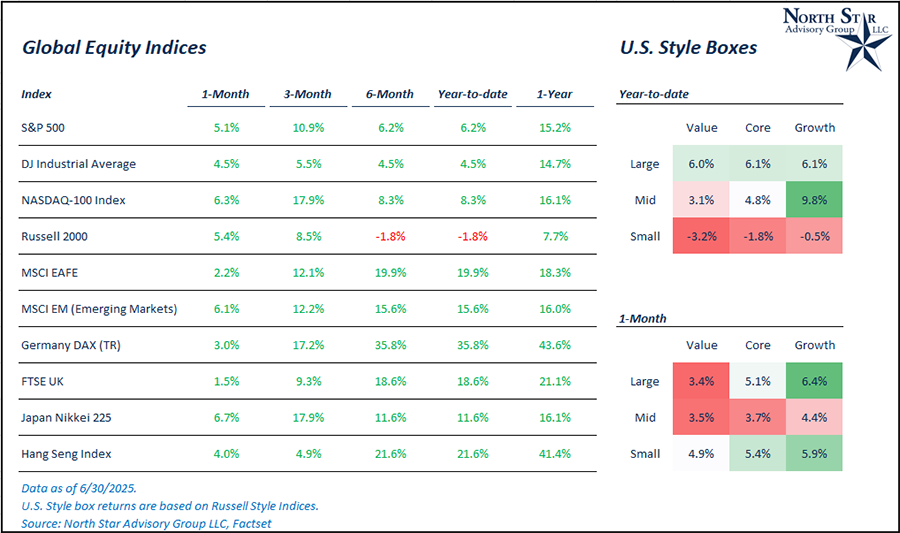
Despite a new administration entering the White House, global trade uncertainty, and new geopolitical conflicts being added to the market equation in 2025, the U.S. stock market has recovered and is positive on a year-to-date basis by 6.2% following another month of positive returns in June (+5.1% for the S&P 500). International Developed and Emerging Market Stocks continue to be the leaders of 2025 as measured by the MSCI EAFE and MSCI Emerging Markets Indices, which are both up by 20% and 15.6% respectively on the year.
From a trade perspective, we aren’t expecting too many more shocks from the Trump administration. In recent months the language coming from the administration has been softer in general with a focus on securing trade deals. While July 9th is the cutoff date for making a deal and avoiding reciprocal tariffs, it sounds like this date will continue to move and flex. U.S. and China inked their preliminary trade deal on June 27th, and the European Union has been deep in negotiating. Additionally, the U.K. trade deal was finalized at the G7 summit, and Trump also teased at a “very big” trade deal coming with India. Canada’s trade partnership hit a new hiccup as Ottawa began imposing a digital services tax which effects U.S. tech firms. In response, Trump ended all trade negotiations with our second largest trading partner. While this trade development is fluid, Canada already rolled back their digital services tax as of 6/30/2025 in response.
From a conflict perspective, Israel and Iran have both agreed to a ceasefire that appears to be holding. Russia and Ukraine’s potential ceasefire and ultimate ending to their war is still up in the air. In addition, the “One Big, Beautiful Bill” is likely to dominate the headlines in the coming days and weeks.
Given all of the moving pieces that are still out there, our view has remained the same; lower but positive returns for U.S. stocks (with higher volatility than average) and outperformance by ex-US markets.
The S&P 500 reached a new all-time high during the month of June. This event has historically led to higher returns over the next 12 months for the index. If the new high occurs within 18 months of a bear market (bear market = drawdown of 20% or more), the historical numbers are even stronger. We wrote about this in Timely Topics just about two years ago, and you can see the table HERE.
We are passionately devoted to our clients' families and portfolios. Contact us if you know somebody who would benefit from discovering the North Star difference, or if you just need a few minutes to talk. As a small business, our staff appreciates your continued trust and support.
Keep sending your questions for a chance to be featured in next month’s Timely Topics.
Best regards,


Mark Kangas, CFP®
CEO, Investment Advisor Representative


Brian Duffield, CFA®
Co-Portfolio Manager & Market Strategist