

Each month we ask clients to spend a few minutes reading through our newsletter with the goal of raising their investor IQ. This month we focus on record oversold conditions and the Fed’s impact on your portfolio.
- Record oversold conditions?
- What is the Fed doing?
- I should have gone to bonds
- Prepare to lose a lot in retirement
- Confusion between nominal & real returns
- Where will the equity markets go next?
Record oversold conditions?
While the Fed’s September commentary caused markets to dramatically sell off, NSAG believes that we have reached significantly oversold levels. While one oversold indicator does not mean that the market will immediately reverse direction, several indicators reaching extreme levels may signal a near-term directional change. NSAG monitors 9 of the most popular technical indicators widely used in the industry which are all showing signs of oversold or extremely oversold conditions. A few indicators are even at extreme levels not experienced in more than 30 years! These technical indicators include:
- Relative Strength Index (RSI)
- Moving Average Convergence-Divergence (MACD)
- Breadth
- Advance/Decline Line
- Stochastic Oscillator
- Commodity Channel Index
- Trend Strength (ADX)
- On-Balance Volume
- Parabolic SAR
For educations purposes, we will review one of these indicators. Breadth indicators are mathematical formulas that measure the number of advancing and declining stocks, and/or their volume, to calculate the participation in a stock index's price movements. By evaluating how many stocks are increasing or decreasing in price, and how much volume these stocks are trading, breadth indicators help in confirming stock index price trends, or can warn of impending price reversals when extreme levels are reached.
The week of September 19th was bad, not only in price, but also in terms of breadth for the S&P 500. While Friday wasn’t an ‘all or nothing day’ to the downside (defined by daily breadth above +400 or below -400), at -369, the daily breadth reading for the S&P 500 came in below -300 for the fourth straight day. The first two of those daily downside readings were -434 and -437, so they actually did qualify as ‘nothing’ days. To put this streak of negative breadth readings in perspective, going back to 1990, there have only been three other periods where the S&P 500 had four straight days of daily breadth readings below -300. The most recent was 6/13/22 and the other two were on 12/24/18 and 8/25/15.
Next month, we will be making our technical indicator dashboard available for clients upon request. If you’d like to understand any of these indicators better, feel free to reach out and have a discussion!
What is the Fed doing?
To some it feels like the U.S. Federal Reserve (Fed) is crashing the economy at the same time that others see the Fed fixing it. The Fed raised its policy rate by 75 basis points (bps) for the third straight meeting, bringing the target rate range to 3.00% - 3.25%. But the Fed isn’t done yet. The Fed’s own forecasts now call for rates to rise to a 4.25% - 4.50% range by December and move a bit higher in 2023. For reference, as of 10/3/22, the market is currently pricing in a ~4.2% policy rate in December. The majority of the Fed members expect at least one more 75 bps rate hike, probably in November, followed by a 50 bps move in December and another 25-bps hike in 2023. Rate cuts do not currently appear in the forecast until 2024 and 2025, though there is a lot of dispersion among members beyond next year.
What is the Fed trying to achieve? Lowering income and spending growth is now the Fed’s only way to reduce inflation over the next 12 months.
- Slow the housing market. Done, mission accomplished and congratulations. Raising 30-year mortgage rates from 3% to 6.5% has dramatically slowed activity and home price appreciation. While we have not yet seen a significant decrease in home values, certain pockets of the country that experienced rapid home appreciation has recently come down by 5-10%. This slowing activity should also assist in slowing the labor and material costs across the construction industry.
- Next, the Fed wants to bring the U.S. growth rate below its 1.8% trend, which should discourage companies from hiring new workers. By softening the labor market, the Fed can strike at the hidden heart of consumer confidence: workers’ conviction that they are unlikely to lose their jobs and could find other gainful employment quickly. This is where we see the Fed running into a problem.
- First, households still have trillions in excess savings from the pandemic and the related stimulus programs.
- Second, household debt service costs are still close to all-time low levels thanks to the legacy of low interest rates over the past decade until this year.
- Third, falling gasoline prices have helped real income growth turn positive for the first time in a year.
- Last, job security is still unusually high, arming consumers with the confidence to spend more and save less.
The Fed has moved faster to fight inflation than any period on record. The quicker pace of interest rate increases has made the U.S. Dollar appreciate at an unprecedented rate and negatively impacted many equity markets around the world. Currency instability quickly leads to market volatility. NSAG expects that currency stability will resume as the Fed slows down their rate hikes and other countries catch-up with their rate increases.
The Fed communicated in late September that they would stay the course with an increased pace of rate increases. If the Fed ignores potentially falling inflation data, they could significantly increase the risk of a recession in 2023.
A couple of things to keep in mind.
- A minor portfolio adjustment maybe warranted if you do not have enough cash, CDs and short-term bonds to ride through current volatility.
- If you are properly allocated and you’re a very long-term investor who doesn’t want to time the market, none of this discussion matters much. Just maintain your normal allocation to stocks and don’t be shy about continuing to buy stocks at your normal intervals. That way you’ll be buying at low stock prices, too, and stocks should be worth substantially more when you’re spending down assets in the future.
- For those investors willing to take some risk on timing the market, we may experience short-term periods of extreme volatility that could provide for better entry points for broad stock indexes than today’s levels.
- Be careful with stock selection. A small group of stocks benefited from COVID stimulus and may never recover to their prior price levels.
I should have gone to bonds
A quick glance of the returns for equity markets may lead investors to think that they should have gone to bonds. We have remained concerned with fixed income over the last two years. The year-to-date performance in the broad equity markets and fixed income markets for 2022 confirms that bonds may not provide the “safe haven” that investors perceive.
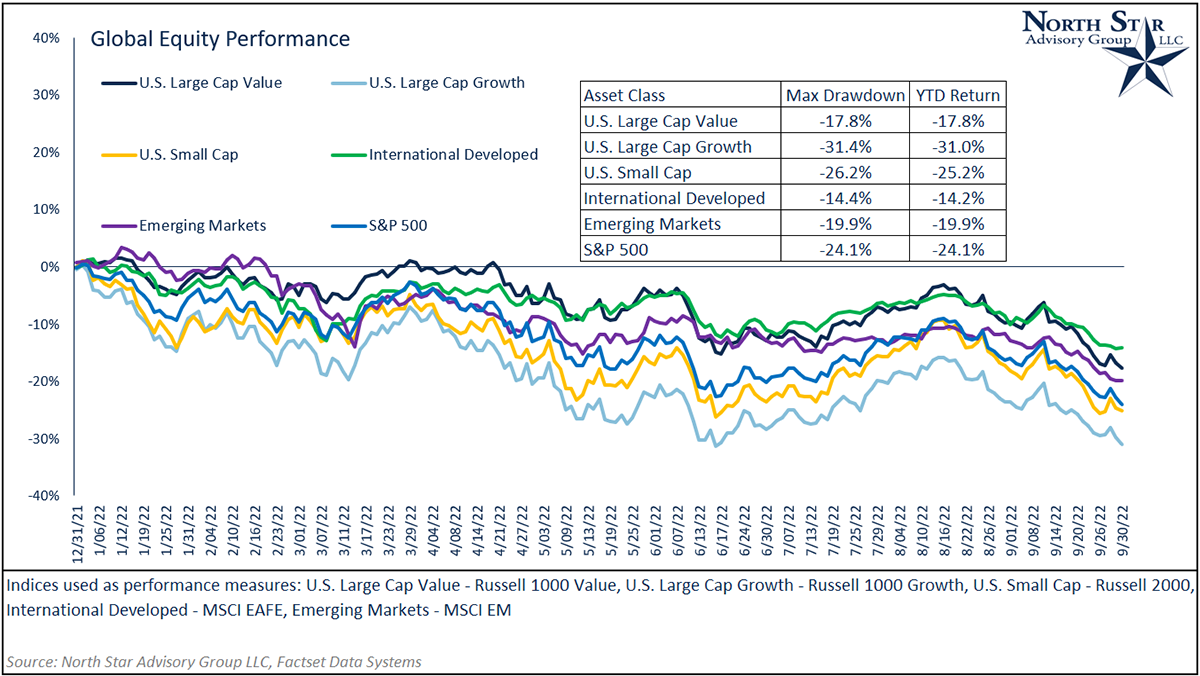
In our first chart for this section, we examine the performance of global equities, including U.S. Large Cap Growth, U.S. Large Cap Value, U.S. Small Cap, International Developed, and Emerging Market Equity. Year-to-date, the best broad performer has been international developed equity, down 14.2% through 9/30/2022. The worst broad performer has been U.S. Large Cap Growth, down 31.0% through 9/30/2022.
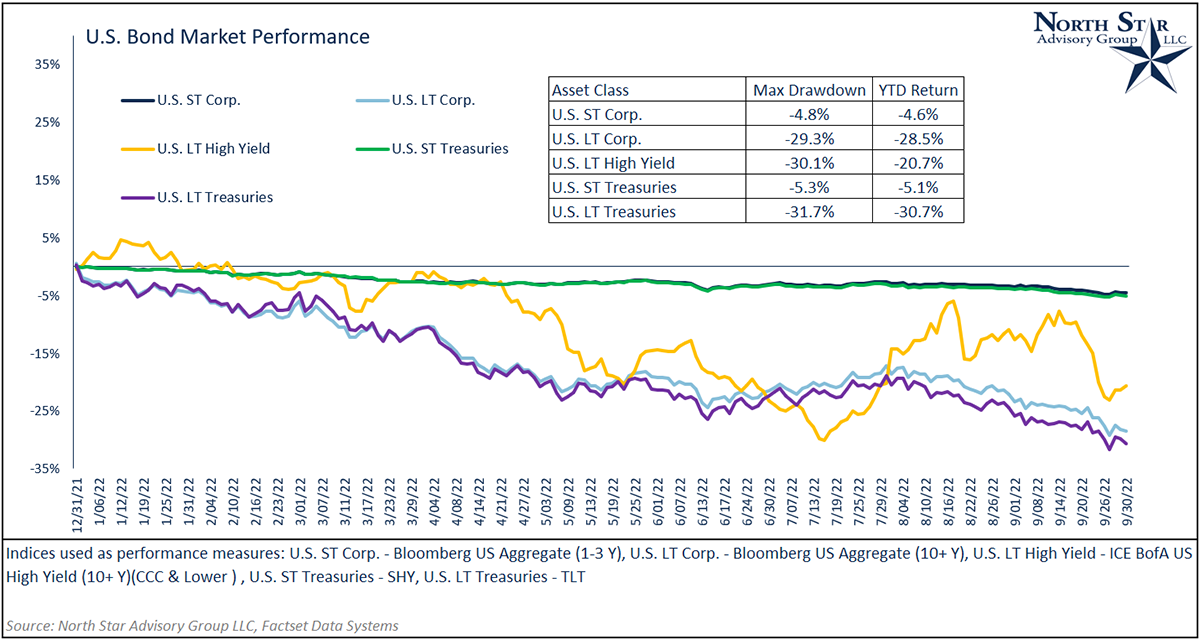
While none of these broad equity indices have been positive year-to-date, you might be telling yourself, “I should’ve gone to bonds.” Before claiming that this would’ve been the correct call, let’s also examine the performance of broad fixed income asset classes. We will look at short-term corporate bonds, long-term corporate bonds, long-term high yield bonds (CCC and lower), short-term U.S. treasuries, and long-term U.S. treasuries.
Between these five classes of fixed income, the worst performance has come from the long end of the yield curve. Performance for these long-term fixed income indices has been -28.5%, -20.7%, and -30.7% for U.S. long-term corporate, U.S. long term high yield, and U.S. long-term treasuries respectively. With respect to short term fixed income, short-term corporate bonds and short-term treasury bills have tracked closely in 2022 with performance of -4.6% and -5.1%, respectively.
At this point, you’re probably asking the question, “Why are these considered safe-have assets?” To unpack the performance, we will return to a couple of hypothetical scenarios. To preface, there are two primary risks relating to fixed income: credit risk and interest rate risk. Relating to credit risk (aka: default risk), we measure this via the “credit spread.” Let’s assume that we bought a AAA corporate bond with a yield to maturity of 4.0% and the benchmark risk-free rate of a US Treasury bond was 3.5%. This results in a credit spread of 0.5% (4% - 3.5%). Six months later, the benchmark risk-free rate is unchanged and the bond issuing firm has come under financial distress, leading to a downgrade from AAA. Due to these changing circumstances, investors will now demand a higher yield on that company’s bond, increasing the credit spread from 0.5%. So, if you were to sell the bond before maturity, you will likely have to sell it for a lower price than originally paid, leading to a capital loss. If you hold it to maturity without the company defaulting, you will receive the original principal in full and same 4% annual coupon yield.
Regarding interest rate risk, we will use the same scenario above. In this scenario, the Federal Reserve significantly increases interest rates over 6 months leading to a higher benchmark risk-free rate, but company fundamentals have not changed. While the credit spread hasn’t changed from 0.5%, investors will still demand a higher yield. This would put you in a similar scenario of losing principal if you were to sell the bond prior to maturity.
Short-term bonds have less price sensitivity to these risk factors compared to long-term bonds. We can observe this lower sensitivity when looking at the performance difference between short-term and long-term bond assets during 2022.
While managing risk inside of bonds is not any different than managing risk in equities, many investors feel perceived safety just because they are in bonds. While NSAG has warned about this risk to investors for years, it finally appears that we are shifting from a 30-year history of falling interest rates into a cycle of rising interest rates. Those investors who hoped to time the market were likely caught off guard by the speed of the interest rate increases and depth of losses on their bonds.
Prepare to lose a lot in retirement
As wealth grows over time, the value of retirement accounts and investment portfolios will tend to have larger fluctuations relating to the total dollar value of the respective account. Some investors find it shocking when for the first time their accounts fluctuate by equal to or more than their annual salary.
Looking back from 1980-2022, the S&P 500 has experienced 37 of 42 years with drawdowns of at least -7% and 25 years with drawdowns of at least -10%. It is for this exact reason that we encourage clients to anticipate and appreciate market volatility. The historical returns and drawdowns of the S&P 500 can be viewed on page 35 of NSAG’s Raising your Investor IQ.
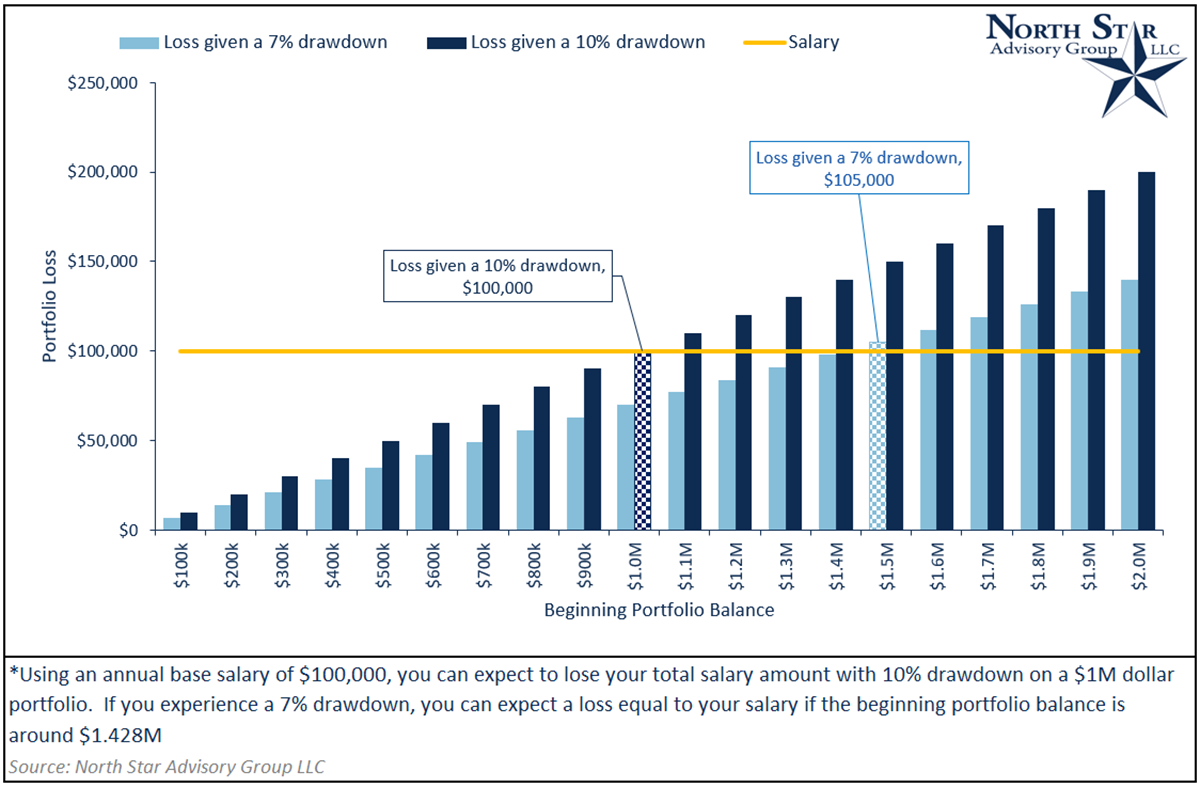
First, let’s examine a hypothetical situation by assuming a client has an annual salary of $100,000. Next, lets determine at what minimum portfolio balance a client would experience a drawdown of $100,000 with a -7% and -10% portfolio fall. If the client experienced a drawdown of -10%, they would need a beginning balance of at least $1M for the drawdown amount to equal their annual salary ($1,000,000 x -10% = -$100,000). Assuming the same scenario with -7% drawdown, the client would need a beginning balance of at least $1.428M for the drawdown to equal their annual salary ($1,428,000 x -7% = $100,000). These two points can be examined in the dark and light blue checkered bars in the chart below.
In these hypothetical drawdown scenarios, it is very likely that -7% and -10% drawdowns have occurred multiple times throughout the years of the portfolio growing and building. The drawdown in dollar value just didn’t have the same magnitude from a psychological standpoint.
Confusion between nominal & real returns
A client recently read online that the S&P 500 had a flat return for 5 years in the early 1980s and asked, “If we are headed into a similar inflationary environment, why would we hold stocks for the next 5 years?” The article misleads readers by reporting real returns vs nominal returns.
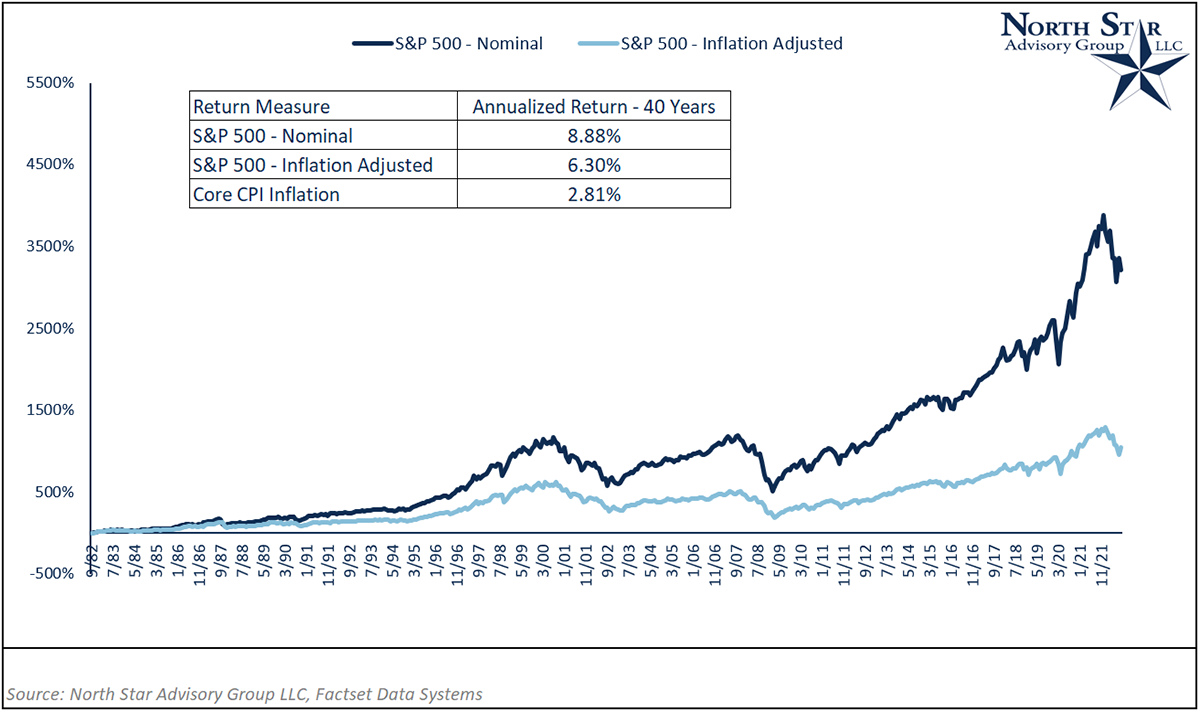
In the broader market, returns are measured “nominally.” Nominal return refers to the actual percentage return for an investment, excluding the impact of inflation. Inflation does not affect your actual returns and actual dollar amounts within a portfolio. Although, when discussing wealth generation, inflation does become a factor. For a household, expenses grow at the rate of inflation, and in 2022, this has become even more apparent for most people. Since inflation’s impact is felt in the cost of living, it is appropriate to measure investment returns nominally. If you were to factor inflation into investment returns, you’d be “double-counting” inflation’s impact on wealth, which is inappropriate.
In the chart below, we examine the nominal cumulative % return vs. the inflation-adjusted cumulative % return for the S&P 500 measured monthly over 40 years. As you can see, inflation takes a very large chunk of your total return over a large time horizon (40 years). Remember:
- Do not to be fooled as inflation has already been factored into your day-to-day lives.
- A portfolio of companies that can pass through inflationary prices tends to be one of the best inflation hedges over time.
Where will the equity markets go next?
Recent equity and bond market performance this year has managed to test the resolve of experienced investors. While markets once again tested recent lows, we expect the continued economic outlook to remain strong enough to minimize future downsize risks to the market. While the risk of a recession has increased with the Fed’s tone in their September meeting, we believe that the strong labor market will pull the US economy through what could be a shallow recession. Labor reports continue to be strong and are not significantly weakened by the recent hike in rates. We expect consumers will continue to utilize their spending power from cash with the comfort that the majority of those who are employed will retain their jobs and continue to spend from recent pay increases and mortgage refinancing discussed in August.
We still believe we are in a secular bull market, which started in 2010 and typically lasts around 15-20 years. However, this secular market is likely to last longer due to a slow start in 2010-2013. It is not uncommon to have bear market pullbacks inside of longer secular bull markets. We saw a bear market in 2020 due to COVID and the markets entered and exited bear market territory twice already in 2022 (May & June).
We are passionately devoted to our clients' families and portfolios. Let us know if there’s somebody who would benefit from discovering the North Star difference, or if you just need a few minutes to talk. As a small business, our staff appreciates your continued trust and support.
Please continue to send in your questions and see if yours gets featured in next month’s Timely Topics.
Best regards,


Mark Kangas, CFP®
CEO, Investment Advisor Representative