


Each month we ask clients to spend a few minutes reading through our newsletter with the goal of raising their investor IQ. This month we focus on the love and heartbreak of investing.
- 2020’s love affair
- 2021’s rough relationship
- 2022’s ugly breakup
- There’s plenty of fish in the sea
- NSAG News
- Where will the equity markets go next?
Explanation of tables in the first three sections:
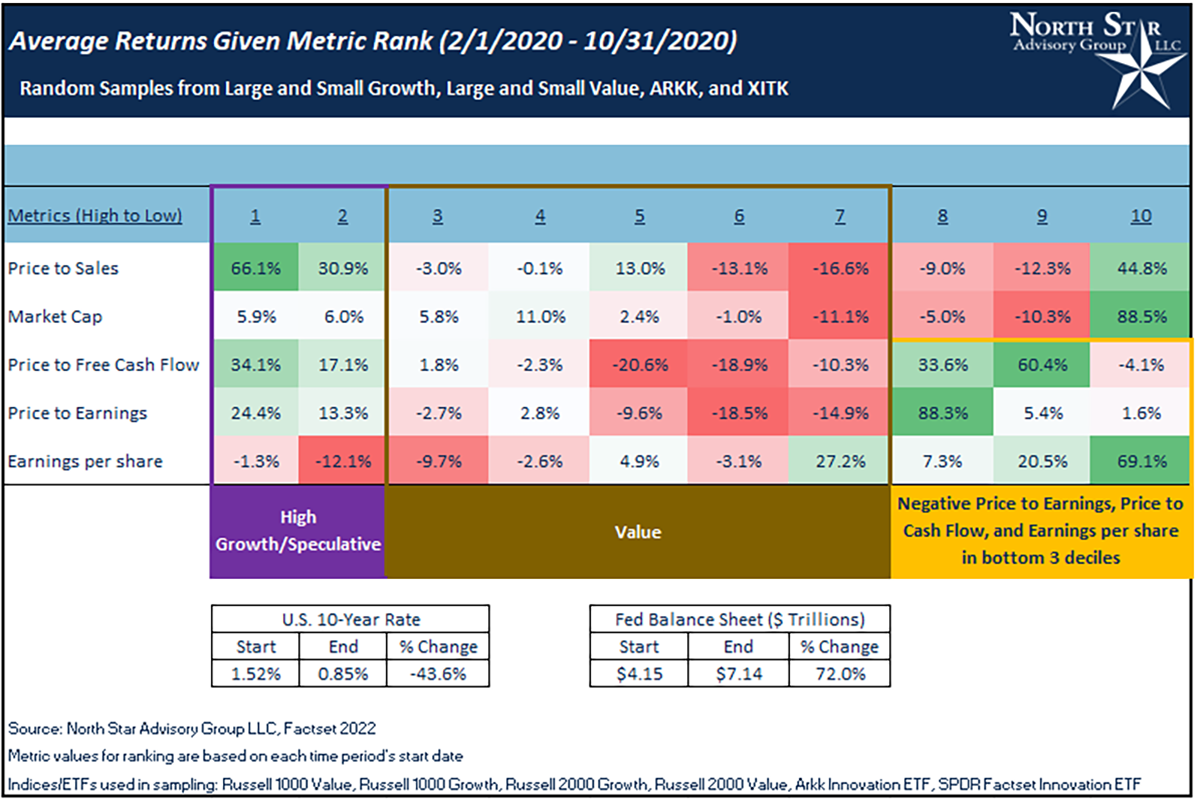
In the three tables below, we randomly sampled 500 companies from a pool of more than 3000 companies across different market segments. In doing so, we then ranked each company by decile from highest to lowest (1-10) and averaged the returns of each decile in different time periods. Five different metrics were ranked by decile: Price to Sales, Price to Free Cash Flow, Price to Earnings, Earnings Per Share, and Market Cap.
- For Price to Sales, the most speculative companies are in the first decile (Highest Price to Sales ratios).
- For Price to Free Cash Flow and Price to Earnings, the most speculative investments are found in the first two deciles and the bottom three deciles, since negative (low) values are grouped into the lower three deciles.
- Market Cap is the number of shares outstanding times the current share price. Therefore, the largest companies are found in the first decile and smallest in the tenth decile.
- When evaluating earnings per share, the highest Earnings Per Share are found in the first decile with the smallest in the tenth decile.
2020’s love affair
A period of free money, low interest rates, green investing, new investors and new investment platforms led to a new love affair with speculative investments in 2020. This newfound love caused many investors to ignore fundamentals and hidden risks associated with hypergrowth stocks, cryptocurrencies, meme stocks and SPACs. These new relationships were exciting, sexy and fun to talk about with friends (even if you were only seeing them socially over video calls).
From February 1, 2020 through October 31, 2020 the Federal Reserve dropped lending rates which caused the US 10-yr rate to drop by 43.6%. The Fed simultaneously increased their balance sheet by 72%! These movements are considered expansionary and supportive to speculative assets and companies with negative cash flow and earnings. The table below shows value stocks generally underperforming speculative assets and companies with negative cash flow and earnings.
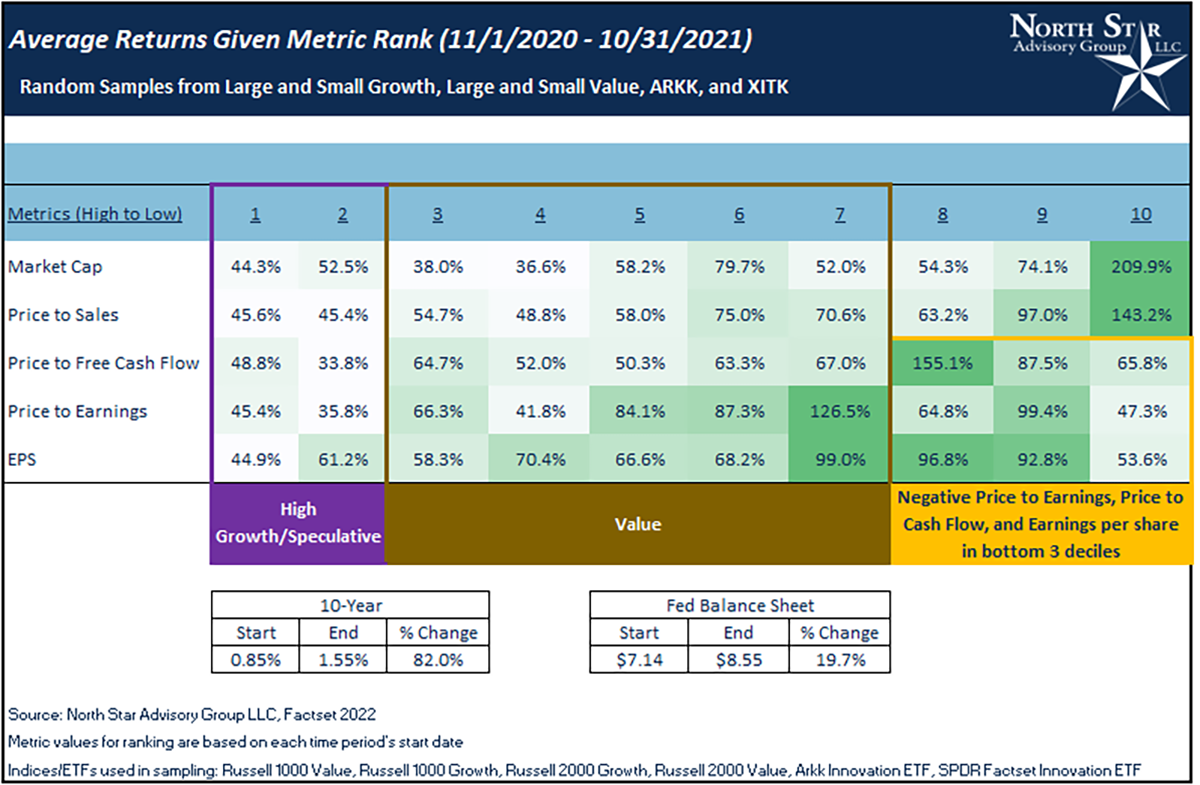
2021’s rough relationship
2020’s love affair ran into rough waters in 2021. The fundamental strength of the relationship (investment) came into question. Even Elon Musk’s star power was unable to boost certain cryptocurrencies with his monologue and appearance on Saturday Night Live. While patience was wearing thin and investors were starting to question their dedication to their 2020’s love, few let this frustration be known publicly. The reality was that behind closed doors everything was not fine. With several companies pushing through 50x price to sales levels, investors would soon have to determine how much they loved their hyper growth positions.
From November 1, 2020 through October 31, 2021, the US 10-year rate increased by 82% and the Federal Reserve increased the balance sheet by 19.7%. Returns began to become more muted and generally, value started to slightly outperform speculative assets and companies with negative cash flow and earnings.
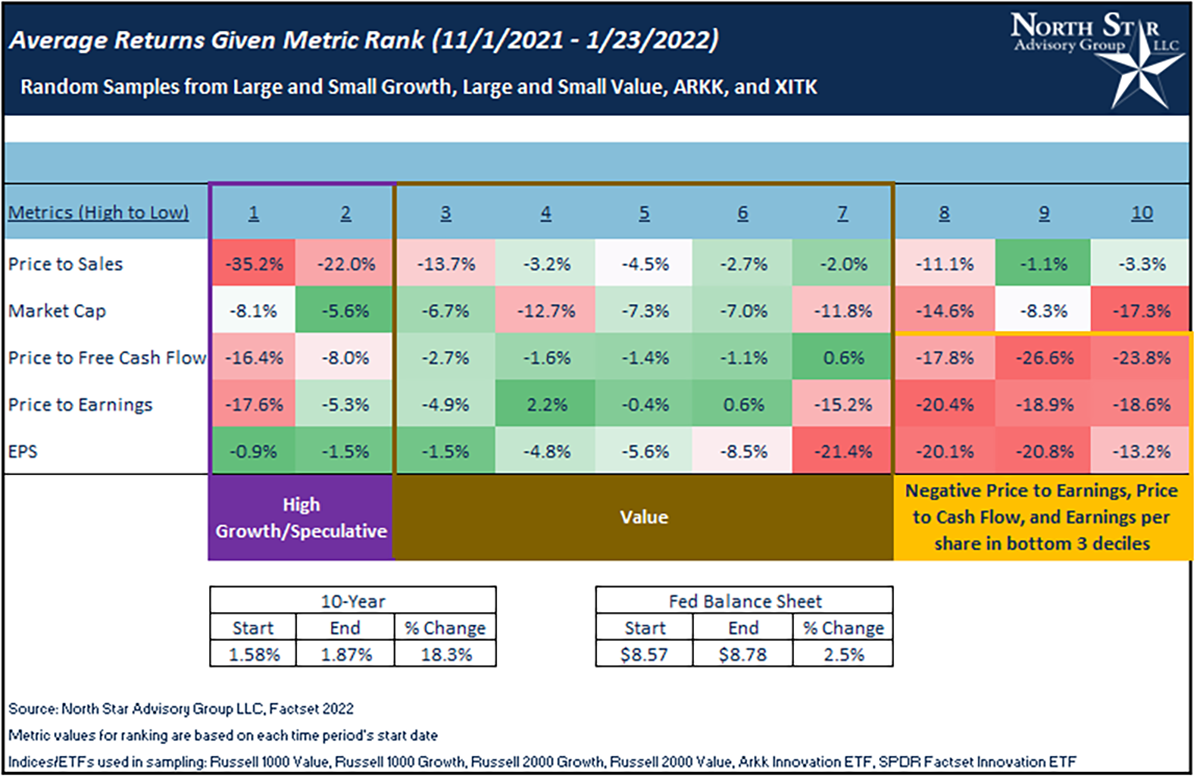
2022’s ugly breakup
It appears that many investors entered 2022 with a new year’s resolution to get their portfolios healthier. If they hadn’t done it already, it was finally time to ditch the old ways and “sugar highs of 2020.”
From November 1, 2021 through January 23, 2022, the US 10-year rate increased by 18% and the Federal Reserve increased the balance sheet by 2.5%. In light of The Fed’s November 2021 meeting, rates continue to increase while balance sheet growth virtually stopped. These two moves do not favor speculative assets and companies with negative cash flow and earnings. The market quickly priced in a contractionary stance by The Fed and value stocks generally started to outperform speculative assets and companies with negative cash flow and earnings.
For many stocks, this is likely not the bottom and they may not see a quick recovery. With the Federal Reserve starting a longer cycle of raising rates and shrinking their balance sheet, we should expect continued pressure for speculative assets and companies with negative cash flow and earnings.
There’s plenty of fish in the sea
This phrase is one we casually toss around whenever we want to console ourselves or a friend after a breakup. This timeless cliché can be applied to unsuccessful relationships or even a failed investment. Investors finally appear to be rediscovering a long-forgotten relationship with stocks that are cash flow positive and have reasonable valuations. While these companies are not as easy to find, they tend to help dampen portfolio volatility. Feel free to reach out to us if you would like to learn more about our process, if you have a portfolio that you would like to have evaluated or you have a few specific companies that you would like analyzed.
NSAG News

We are very pleased to announce that Brian Duffield passed the November 2021 Level I Certified Financial Analyst (CFA) Exam. The nationwide pass rate was only 27%! Historically, this was a very hard test; the pass rate was 22% and 25% for the July and May 2021 exams, respectively. Pre-COVID-19, pass rates were typically in the 40% range. The CFA Institute has maintained the exam isn’t getting harder. Their method of setting the minimum passing score ensures the passing candidates maintain a high and consistent level of knowledge. The lower passing rates are likely due to COVID-19.
The continued success of NSAG’s practice and our employee’s passing rate of certifications is a huge credit to the dedication we bring to each and every one of our clients. Cheers Brian! Enjoy the next few weeks before you start studying for the Level II exam this fall!
More about the CFA designation:
A Chartered Financial Analyst (CFA®) charter is a designation given to those who have completed the CFA® Program and completed acceptable work experience requirements. The CFA Program is a three-part exam that tests the fundamentals of investment tools, valuing assets, portfolio management, and wealth planning. Each candidate must complete years of education prior to sitting for the first exam. Each exam typically requires more than 300 hours of studying and exams are typically taken once a year. Adding this all up puts Brian on a 4+ year track to obtain his CFA designation.
Where will the equity markets go next?
While volatility appears to be the early trend in 2022, properly diversified portfolios have done a great job of weathering the storm. Uncertainty over the pace of interest rate hikes by The Federal Reserve has caused many investors to likely overreact and oversell. As of Mid-January, we are seeing the NASDAQ and S&P 500 being oversold. Oversold conditions could mean we are close to a near term bottom if the specific oversold sectors of consumer services, consumer discretionary and/or technology can gain some traction.
We continue to see significant pullbacks focused in areas of speculation and those impacted the most by rising interest rates. The continued rotation from growth to value is likely to continue for at least the next year and is picking up steam as interest rates rise in connection with either COVID variants slowing down, rising inflation or both.
There continues to be virtually zero risk of a double-dip recession and the Federal Reserve is prepared to speed up or slow down when necessary. As a reminder, a recession is approximately six months of negative GDP. Even with The Fed raising rates, virtually no economists are forecasting negative GDP figures resulting in a recession. Less growth does not equal a recession. We still believe we are in a secular bull market, which started in 2010 and typically lasts around 15-20 years. However, this secular market is likely to last longer due to a slow start in 2010-2013.
We are passionately devoted to our clients' families and portfolios. Let us know if you know somebody who would benefit from discovering the North Star difference, or if you just need a few minutes to talk. As a small business, our staff appreciates your continued trust and support.
Please continue to send in your questions and see if yours gets featured in next month’s Timely Topics.
Best regards,


Mark Kangas, CFP®
CEO, Investment Advisor Representative