

Each month we ask clients to spend a few minutes reading through our newsletter with the goal of raising their investor IQ. This month’s topics include:
- Expect more days like July 19, 2021
- Chinese government disrupts market valuations
- Too excited about airline stocks?
- Summer Olympics impact on the markets
- NSAG news
- Where will the equity markets go next?
Expect more days like July 19, 2021
After a week of vacation with my family, I returned to the office on July 19 to see the S&P 500 dropped 68.67 points or 1.59% and the DOW dropped 725.81 points or 2.09% respectively on the first day back. We are constantly looking for reasons and explanations for daily movements like this, but this day there were none. My 6 am ritual starts with checking how international markets are doing and what the pre-market indication is for the US markets. On July 19, they were indicating a slightly down day, but nothing near a 300, 500 or 725 point down day.
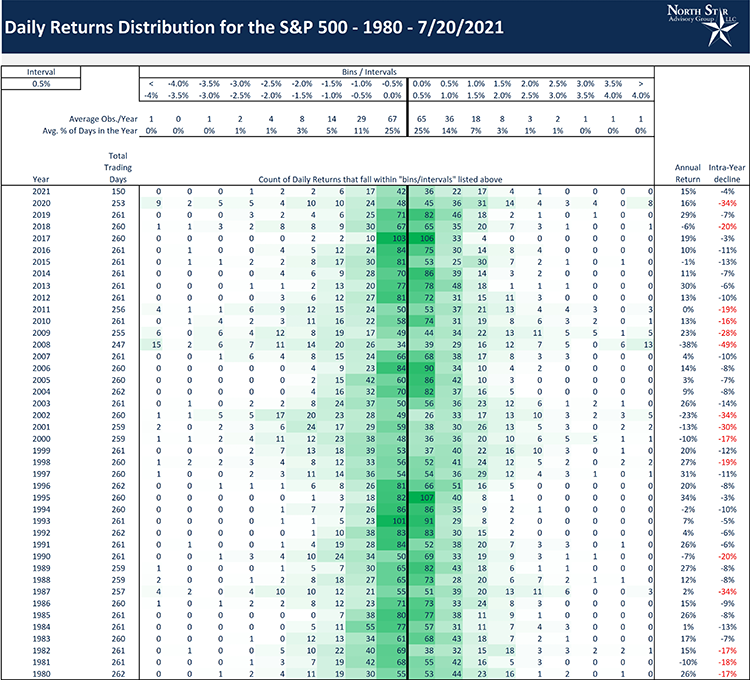
It is not uncommon to see the markets unravel like this. Some days, selling can lead to additional selling and short-term panic. As historians of the market, we have a good perspective on what is normal for the market, and this day was not out of the expected range. Knowing that this is concept can be hard for clients to wrap their arms around, we have produced a research report tracking the daily return distribution for the S&P 500 from 1980 through 7/28/2021 to produce the following chart. To help summarize the chart for the average daily returns:
- 75% of the time between -1% to 1%
- 36% of the time -1% and 0%
- 39% of the time between 0% to 1% (which provides a positive skew)
- 87% of the time between -1.5% to 1.5%
- 5% of the time or 14 days per year, the returns fall between -1.5% to -1%
- 12% of the time the market is down more than 1.5% or up more than 1.5%
- 2020, 2008 & 1987 were years with sharp and quick volatility that helped to skew these ranges with several daily moves +/- 4%
- -1.59% days like 7/19/21 occur 3% of the time or on average 8 times a year
North Star has made a very large investment into personnel, technology and data. This research report is just one example of supporting data that we are now able to produce and dynamically update each month.
Chinese government disrupts market valuations
As the Chinese government cracks down on companies in various sectors of its economy, Hong Kong stocks have fallen hard to finish out July. The benchmark Hang Seng Index was down more than 4% on two consecutive trading days, and while it didn't quite finish the day in bear market territory, it is currently down 19% from its peak in February.
Looking back at the history of the Hang Seng Index, it has been no stranger to volatility. From 1970 right up through the handover of control in 1997, two-day changes of 7.5% or more occurred pretty frequently. Then, during the Asian currency crisis of 1997 and right up through the Russian debt default in 1998, there was also a surge in occurrences. From the fourth quarter of 1998 through early 2007, though, there were only a handful of occurrences during the dot-com bust. After the volatility of the Financial Crisis subsided, there has only been one other period in 2011 where the Hang Seng experienced a two-day decline of more than 7.5%, and there hasn't been a single two-day decline since the Financial Crisis that has exceeded the magnitude experienced in July 2021.
No two periods are exactly alike, and the prior sell-offs in Hong Kong weren't rooted in government crackdowns on some of the largest companies listed in the region. With that caveat, based on prior history, the two-day decline of more than 8% in the Hang Seng would suggest the potential for a short-term bounce while there could be some ripple effect in the performance of the S&P 500 over the short term. Longer-term, there has been a muted impact on US equities from quick and sharp drawdowns in the Hang Seng like the one we have seen this month.
Too excited about airline stocks?
Despite concerns over COVID variants, Americans are increasingly returning to a more normal way of life that existed in the pre-COVID days. One example is in air travel. Based on statistics from the TSA, an average of slightly more than 2 million people have passed through airport security checkpoints over the last two weeks, and that's right near the highest levels of the pandemic. Not only are air passenger numbers near post-COVID highs, but they're actually right near levels that were in place early last year before Americans had ever even heard of COVID.
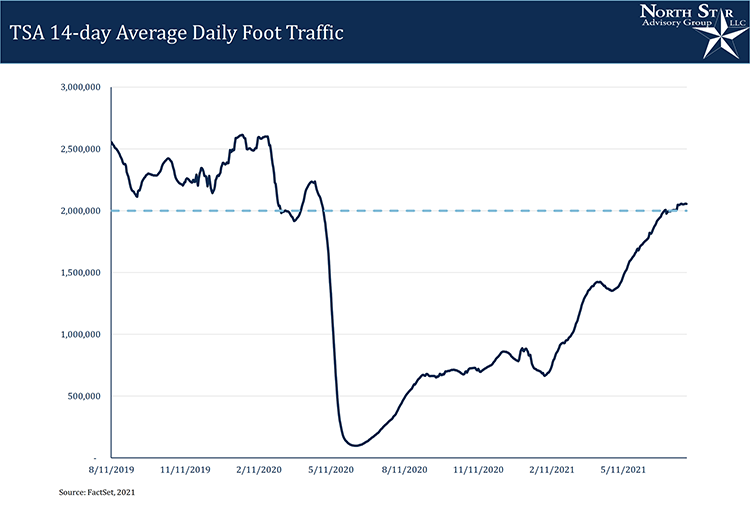
Throughout much of the pandemic days last year, there was a relatively close relationship between TSA passenger throughput numbers and the performance of airline stocks. COVID was quick to make its presence felt, but even still, the performance of airline stocks sniffed out the impending doom slightly before the actual decline in travel started to show up. Then, late last year, the airline stocks got caught up in the re-opening trade and surged ahead of what was a breakout in air travel three months later. While airline stocks led the move in passenger traffic to both the upside and downside, more recently we've seen an outright divergence between the two. As passenger traffic continues to surge, airline stocks have been trading lower for the last four months. Is the weakness in airline stocks foretelling another downturn in passenger traffic? Nobody knows the future, so anything could happen, but some of the recent weakness in airline stocks may be the result of an overall consolidation in the re-opening stocks after the post-election surge. Not only that, but the capital structure of airlines today looks nothing like the structure of these companies prior to the pandemic. These companies took on enormous debt loads to get through the pandemic. As noted by the Financial Times, after taking on more than $40 billion in debt in 2020, airlines have raised an additional $16 billion in 2021. All that debt adds up and paying off that debt will act as a drag on the profitability of the sector moving forward.
Summer Olympics impact on the markets
With the 2020 Olympics in Tokyo in full swing, we're all enjoying the summer games heroics. We were curious what the market implications of the Olympics might be. For perspective, we looked at S&P 500 performance between the opening and closing ceremonies since 1928, which is both when data for that index and the current roughly two-week window for the games begins. As shown in the table below, the games average a 1.7% gain from the close on the day of the opening ceremonies through the close on the day of the closing ceremonies. While the market only rises 57% of the time during the summer games, its maximum drawdown is only 2.9% over the course of the period. Home country equities follow a very similar pattern of performance to the S&P 500 since 1984, but we don't have comprehensive data going back as far for these countries so it's a more limited sample set. One final note: while one might expect the games and their constant flow of sports drama to interrupt the activity on trading desks, total US equity exchange volume doesn't look too different during the games versus the average in periods immediately before or after.
NSAG news
Over the past few months, North Star made a new and very large ongoing investment into additional research personnel, technology, and data. The research in this Timely Topics is just one example of supporting data that we are now able to produce and dynamically update each month. Keep the questions coming and we will continue to provide timely and detailed education.
Where will the equity markets go next?
In December 2020, we were seeing a growing probability of the S&P 500 hitting 4,200 by the end of the year 2021. The breadth of the recovery we are seeing for the balance of 2021 along with some technical analysis, should provide support for the current 4,400 level and additional modest growth into year-end. Analysts continue to slowly raise their forecast over 4,200. While the path forward will not be a straight line, we expect any pullbacks to be modest and focused on areas of bubbles and rising interest rates. The continued rotation from growth to value is likely to continue for at least the next year.
It’s now clear that there is virtually zero risk of a double-dip recession. We still believe we are in a secular bull market, which started in 2010 and typically lasts around 15-20 years.
We are passionately devoted to our clients' families and portfolios. Let us know if you know somebody who would benefit from discovering the North Star difference, or if you just need a few minutes to talk. As a small business, our staff appreciates your continued trust and support.
As a small business, our staff appreciates your continued trust and support as we all work through these stressful and trying times for our country and world.
Please continue to send in your questions and see if yours gets featured in next month’s Timely Topics.
Best regards,


Mark Kangas, CFP®
CEO, Investment Advisor Representative