

Each month we ask clients to spend a few minutes to read through our newsletter with the goal of raising their investor IQ. To properly address client questions on bubbles and their potential impact on the markets, this month’s Timely Topics is a long one. Enjoy!
- Bubbles, bubbles everywhere!
- Rising interest rates show confidence
- Bond prices have and will continue to get crushed
- Parts of the market are about to relive the Tech crash of the 2000s
- Surprises for 2021: Consumer balance sheets, Tech IPOs & US real estate vacancy rates
- Where will the equity markets go next?
Bubbles, bubbles everywhere!
While current client questions are different, many of them are focused on the growing concern of seeing asset bubbles all over the world. This month we focus on past bubbles to provide perspective and highlight a few current bubbles we see popping up. Finally, we will tie it all together with our thoughts on the potential of a widespread stock market crash.
Once recent client email summarized the collective concerns:
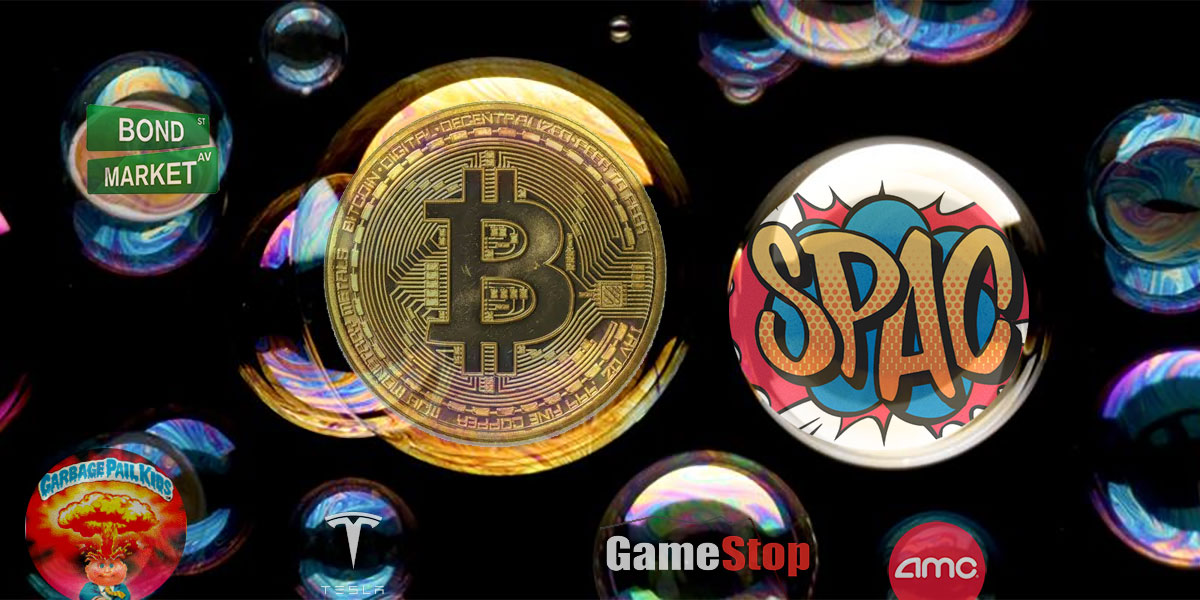
“It seems like there are multiple potential bubbles...the tech industry, GME/AMC stocks and Robinhood, Bitcoin/Dogecoin and Elon Musk ‘moving the markets’, card collection for sports/Pokémon/Magic, metals gold/silver prices rapidly increasing, sneaker flipping and the housing market. I’m not sure if buying into any of these things to make a profit is any less risky than the casino but something new seems to be in the news all the time. Are these bubbles? Just another high-risk money pit?”
Every couple of years new bubbles form and draw in speculators. With discipline, research and a well-defined process it is possible to invest, buy and sell prudently during a bubble. An asset bubble is when an asset dramatically rises in price over a short period that is not supported by the value of the product. The hallmark of a bubble is irrational exuberance—a phenomenon when everyone is buying up a particular asset. Irrational exuberance is unfounded market optimism that lacks a real foundation of fundamental valuation, but instead rests on psychological factors. Markets and economies have survived previous bubbles and the ones we are experiencing today are not near the magnitude of the ones that we have experiences in the past.
Notable past asset bubbles:
- 1630s Dutch Tulip prices increased by 2,000% before falling 99%
- 1720 South Sea Company grew by 800% before collapsing
- 1980s Japan's Real Estate and Stock Market. At the peak in 1989, the value of the Imperial Palace grounds in Tokyo was greater than that of real estate in the entire state of California.
- 1990s Dotcom era saw the NASDAQ increase 900% before falling 80% in the 2000-2002.
- 2006 Housing bubble & crash had varied impacts around the globe.
- 2000s Oil prices climbed 475% before falling 63%
- 2011 Gold reaches a record high of $1,917.90 then fell 17%
- 2012 Treasury Notes yields rose about 75% in just a few short months causing bonds to lose money.
- 2014 and 2015 the U.S. Dollar rose sharply causing global asset price disruption
- 2017 Bitcoin rose over 1650% before falling 82%
Notable current bubbles:
- Bonds… Investors have been indifferent to rates and willing to pay virtually any price for bonds. Twice in 2020, the US 10-year Treasury yield touched 0.5%. Rising interest rates tend to be a headwind for bond prices. While a perceived place of safety, many bond funds have lost money in 2021. Investors who recently made new 10-year purchases may experience years of losses.
- Bitcoin… During the first two months of 2021, this digital currency has climbed another 100% after an over 300% increase in 2020. Digital currencies are being touted as an alternative to gold and the US Dollar as a place to store wealth. However, once downward pressure resumes, consumers may be unwilling to park savings in a cash alternative that is losing money. This change may quickly end gains and accelerate losses.
- Tesla has a speculative cult following. JD Power currently ranks Tesla 30th out of 33 for dependability and Tesla has not been able to generate a profit by selling cars. Even worse, the electric car manufacturer is quickly being outsold by other manufacturers in Europe and this trend is likely coming to the US as well. Tesla (and many other companies) have recently shifted some of their cash on hand into Bitcoin. Now Tesla’s stock price is not only being moved by their actions as a company, but the outside volatility of Bitcoin. After an incredible run up, Tesla could be subject to an even faster fall from grace.
On the lighter side… GM is making a bold Electric Vehicle (EV) call. Click HERE to watch. - Special Purpose Acquisition Companies (SPACs) are also known as "blank check companies," which are shell corporations listed on a stock exchange with the purpose of acquiring a private company, thus making it public without going through the traditional due diligence process involved in an initial public offering (IPO). Investors are attracted to the potential returns by getting in on the ground floor, but investors are also risking significant downside by investing without even knowing what the SPAC is going to purchase, if the terms of the deal are reasonable, if the SPAC ‘s leadership will be involved in the new company for a long time or exit once a deal is completed.
- Speculative trading with calls and margin… there has been a surge in retail investors trying to magnify their returns by increasing their trading volume in calls in the futures market and positions being bought on margin. Everybody loves leverage when the market is going up, but downside volatility can not only erode gains, but cause you to sell other stronger parts of your portfolio to gain liquidity. This type of liquidation was briefly experienced in February 2021 when Game Stop’s stock came crashing back to reality.
- Game Stop & AMC… Speculative trading by both individuals and professionals caused the stock prices of these two companies to swing wildly. Game Stock is the Blockbuster of video games and therefore they are likely to go bankrupt as their customers now directly download their games. AMC has taken on massive amounts of debt to survive COVID and now AMC is facing a direct-to-consumer distribution from Hollywood that was never as strong as it is today. Any trading in these names is nothing other than gambling and any investor attempting to rationalize these trades based on fundamentals and earnings potentials is missing the reality of how technology will destroy these companies in a post COVID world.
- Penny & Sub penny stocks… trading volume has picked up in stocks with prices less than a dollar and even less than $0.01. Yes that is correct, clients are requesting to trade in shares of stocks worth less than a penny! Some of these investments have decreased by over 25% in just the past week.
- The demand for trading cards for baseball, basketball and even Garbage Pail Kids has picked back up. Companies like eBay are facilitating transactions while collectors are stuck at home during Covid.
While this is not an all-inclusive list, we hope it gives you a good handle on what we are seeing. Across many of these categories, North Star is seeing clients, friends, neighbors and personal trailers exchanging hot tips for places to invest for a fast return. Some investors have and will be successful, but unfortunately many will get hurt when participating in bubbles like these. Thankfully, many of these bubbles are smaller in size and while they may have a similar short term impact on the market like we experienced with Game Stop earlier this year, fundamentals are still strong and should help equity prices correct in a relatively short period of time.
The million dollar question is “when will these bubbles start popping.” My best guess is the second half of 2021. To pop the bubbles, you have to take the cash away that is supporting their growth. These bubbles are being supported in three ways:
- The Federal Reserve is keeping rates low for longer which is causing asset prices to increase. The Fed is not going to increase rates soon, so this is not a large concern for now (unless you are a bond holder).
- Many new investors are using stimulus money. Money that is given, but not earned is treated differently and investors tend to assign a higher risk level since they have noting to lose when playing the market with federal handouts. Once the stimulus dollars stop, there will be less higher risk dollars flowing into the markets.
- The perceived safety from mass vaccinations and herd immunity will cause consumers to leave their house. Those who were entertaining themselves with risky investments in the market with money that otherwise would have been spent, will start to resume their normal spending patterns and reduce this flow of speculative money into the markets.
Rising interest rates show confidence
In late February, Powell stated “the economy is a long way from our employment and inflation goals, and it is likely to take some time for substantial further progress to be achieved.” However, he said yields are rising both because of higher inflation expectations as well as anticipation for a pickup in economic growth later this year. “It’s a statement of confidence by markets.” In spite of the Fed’s goals for inflation and employment, we may start to see rates slowly increase, which may cause losses for bond investors.
The outlooks for equities is increasing while decreasing for bonds
Longer maturity U.S. Treasury yields continued to climb last week, while shorter maturities remained firmly anchored. Stronger-than-expected economic data pushed 10- and 30-year Treasury yields above their March 2020 peaks for the first time since the pandemic. Interestingly, last week’s rate jump was not accompanied by rising inflation expectations. In fact, implied inflation expectations actually fell!
As the pre-pandemic days start to fall further in the past, one-year charts of various financial assets are starting to look a lot different. Take the yield on the 10-year US Treasury. Along with the fact that yields are rising, the higher levels of rates from before the pandemic are falling out of the one-year window. Through that combination of events, today's yield of 1.3721% would mark a 52-week high on a closing basis. It's been a while since we've been able to say that! As if the chart doesn't look interesting enough now, wait until late March when the down leg falls completely out of the picture.
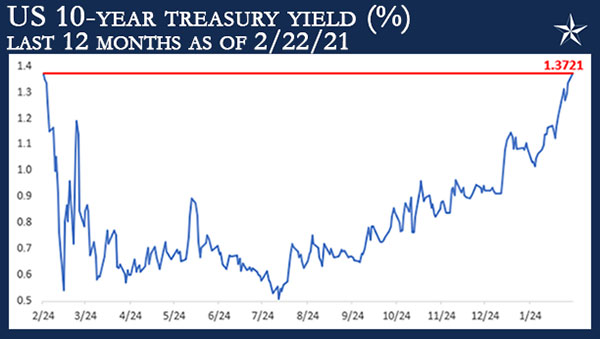
All of this is generally good news for stockholders since it is due to a strengthening economy. However, it is not great news for holders of bond funds with longer maturities. North Star’s clients are generally invested into short-term bonds and are therefore more immune to this type of price movement. While the intermediate bond funds are generally down year-to-date, our short-term bond holdings are showing a positive return in spite of rising rates.
Rising interest rates can put pressure on high growth equities and our portfolio managers have already started to reposition the portfolios in preparation for this pending risk.
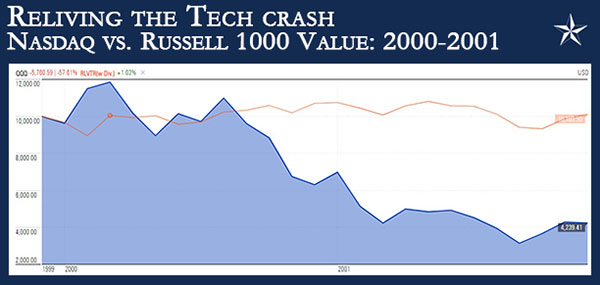
Parts of the market are about to relive the Tech crash of the 2000s
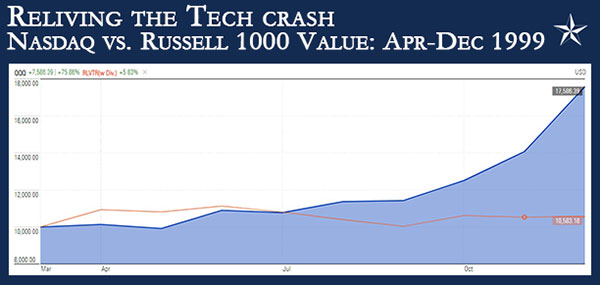
The mental and financial scars from the boom and bust of technology stocks in 2000 have investors worried about a risk of this type of market crash repeating. North Star foresees this type of crash coming, but isolated down to assets that have recently increased in a parabolic manner. Due to the increased speed of technology, we expect the speed of the fall is likely to be faster than the slow three-year bleed that took place in the early 2000s. Lets take a quick look at what happened to the NASDAQ in the late 1990s as an example of what could happen today, just in a faster fashion.
The NASDAQ was dominated by technology stocks in the late 1990s and saw the NASDAQ increase 900%! The NASDAQ went parabolic in 1999. As shown in the following chart, from April 1 through December 31, 1999 the NASDAQ went up more than 75%! During the same time, the Russell 1000 Value index was up just less than 6%. The Russell 1000 Value Index is a broadly diversified index predominantly made up of the 1000 largest value stocks of large U.S. companies. The significant underperformance by the Russell 1000 Value index caused many investors to break their discipline, research and a well-defined process to chase returns and risk inside the NASDAQ.
Part I, the crash in 2000… The same investors that thought they couldn’t lose by investing into tech stocks learned a very sobering lesson after the clock struck midnight on December 31, 1999. During 2000, the NASDAQ fell -37% while the Russell 1000 Value was up +7%.
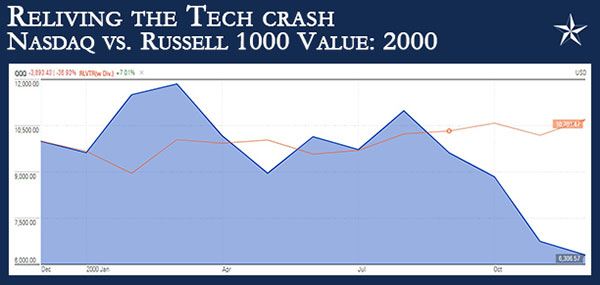
Part II, the crash in 2001… After the 37% selloff in 2000, investors thought that a bottom was in and many tried to dollar-cost-average into names that had fallen. Stock brokers were famous for saying to clients “if you loved XYZ stock at $100, you are gonna love it even more at $60.” Unfortunately, the NASDAQ continued to fall another -33% while the Russell 1000 Value fell -6%. Cumulatively from January 1, 2020 through December 31 2001, the NASDAQ has fallen -58% while the Russell 1000 Value was up +1%.
Part III, the crash in 2002… For 2002, the NASDAQ continued to fall another -38% while the Russell 1000 Value fell -16%. Cumulatively from January 1, 2020 through December 31, 2002, the NASDAQ has fallen -74% while the Russell 1000 Value is down -15%.
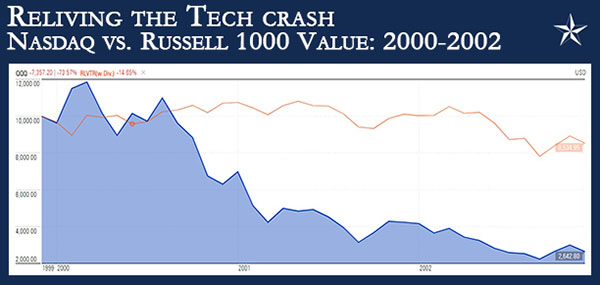
As illustrated by using the NASDAQ, this -74% crash impacted a lot of companies. In contrast, the use of the Russell 1000 Value shows that there was a whole part of the market that was relatively immune to the “crash.” Technically speaking, the 15% pullback in the Russell 1000 Value does not even constitute a bear market. North Star is not a firm that only invests in value or growth. North Star’s investment process focuses on investing into assets for growth at a reasonable price/risk. Therefore, our clients should experience a lower risk from a crash after a parabolic move up.
Surprises for 2021: Consumer balance sheets, Tech IPOs & US real estate vacancy rates
The markets have their growth hopes squarely on the shoulders of the vaccination rollout and consumers leaving their house. For March, we are going to cover how the overall strength of the economy will be supported by consumer balance sheets, Tech IPOs and pending US real estate vacancy rates.
Where will the equity markets go next?
We are seeing a psychological shift in society from despair to hope. This transition is common after a natural disaster. In December 2020, we were seeing a growing probability of the S&P 500 hitting 4,200 by the end of the year 2021. The breadth of the recovery we are seeing for the balance of 2021 along with some technical analysis, may see the S&P 500 exceed these numbers. While the path forward will not be a straight line, we expect any pullbacks to be modest and focused on areas of bubbles.
The markets should continue to be supported by the Federal Reserve, stimulus from central banks around the world, cash on the sidelines, low interest rates, recovering earnings and investors who overallocated to bonds. The 2021 economy is proving stronger than anticipated. Estimates are indicating that real GDP will rise at about a 6.0% annual rate in the first quarter, and grow about 5.0% (Q4/Q4) in 2021. Yes, we know that the Atlanta Fed’s GDP Now model projects a 9.5% growth rate for Q1, but that model has been overestimating growth since the recovery started and doesn’t factor-in the polar vortex that has wreaked havoc throughout much of the mid-section of the country in February.
Either way, it’s now clear that there is virtually zero risk of a double-dip recession. In fact, a new $1.9 trillion stimulus bill is winding its way through the legislative process. This massive package includes a further extension of unemployment benefits, direct help for households and businesses, more money for vaccinations, $350 billion for state and local governments, and $170 billion for education. Putting this all together, we still believe we are in a secular bull market, which typically lasts around 15 years.
We are passionately devoted to our clients' families and portfolios. Let us know if you know somebody who would benefit from discovering the North Star difference, or if you just need a few minutes to talk.
As a small business, our staff appreciates your continued trust and support as we all work through these stressful and trying times for our country and world.
Please continue to send in your questions and see if yours gets featured in next month’s Timely Topics.
Best regards,


Mark Kangas, CFP®
CEO, Investment Advisor Representative