

Here are the key topics that we cover this month:
- Presidents have less of an impact on the market than you think
- Don’t let your emotion wreck your returns
- Volatility is likely to pickup
- Tech’s Q3 Performance has been a dog!
- Record earnings season
- Biden’s tax increase for Social Security
- Our GARP process has not waivered
Presidents have less of an impact on the market than you think
With the Presidential election less than three months away, analysis over which candidate is better for the stock market is starting to take up the spotlight. While conventional wisdom says that Republican Presidents are better for the stock market, historical market performance suggests otherwise.
We looked back at the Dow Jones Industrial Average’s (DJIA) return under every President since 1900 from the time they took office to the time they left. For the 12 presidents since 1900 (including Trump), the DJIA’s average annualized return during their tenure has been a gain of 3.5%. For Democrats, though, the average is nearly twice as much at 6.7%. Since WWII, the spread between Democrats and Republicans is a bit narrower (7.5% vs 6.1%), but that’s shrinking what was already a small sample size of 20 to 13.
While historical returns of the market under different political parties receives a lot of attention, its impact is a bit over-rated. A President’s policies can have an impact on the performance of stocks in specific industries, but even though it is considered the most powerful position in the world, not even the President is big enough to fully steer the US (or global) economy. More often than not, Presidents deal with the hand they’re dealt rather than act as the dealer themselves.
Look no further than President Trump and President Obama to see a real-world example of this. If there is one thing everyone can agree on, it is that in both their policies and personalities, the two men couldn’t be more different. However, when we look at sector performance under each President’s time in office, the results look a lot more similar than different. During Obama’s tenure as President, the two best performing sectors in the S&P 500 were Consumer Discretionary (+338%) and Technology (+286%). The two best performing sectors under President Trump? Consumer Discretionary and Technology. Under Obama, the worst-performing sector in the S&P 500 was Energy (+53%). Under Trump? Energy as well (-47%). These aren’t the only similarities either. Of the six sectors that underperformed the S&P 500 during Obama’s eight years in office, five of them are also underperforming during Trump’s tenure as well. Conversely, of the three sectors that have outperformed the S&P 500 during Trump’s tenure, two also outperformed during Obama’s eight years.
Besides the fact that market returns under different political parties gets more credit than it deserves, conventional wisdom regarding individual Presidents seems to be wrong more often than its right. For both President Clinton and Obama, expectations were extremely low leading into their administrations, and by the end of their terms in office, the annualized returns of the DJIA for each of them ranked in the top three for all Presidents since 1900. Similarly, President Trump was a wildcard heading into the 2016 election, and when he won, US equity futures immediately plunged. No one ever sells stocks because they are bullish on the outlook, but with a 9.4% annualized gain since he took office, returns under President Trump have also been better than average. The key lesson as we approach November is that if Biden wins, whatever the conventional wisdom is for his impact on the market, the smart move will likely be to do the opposite.
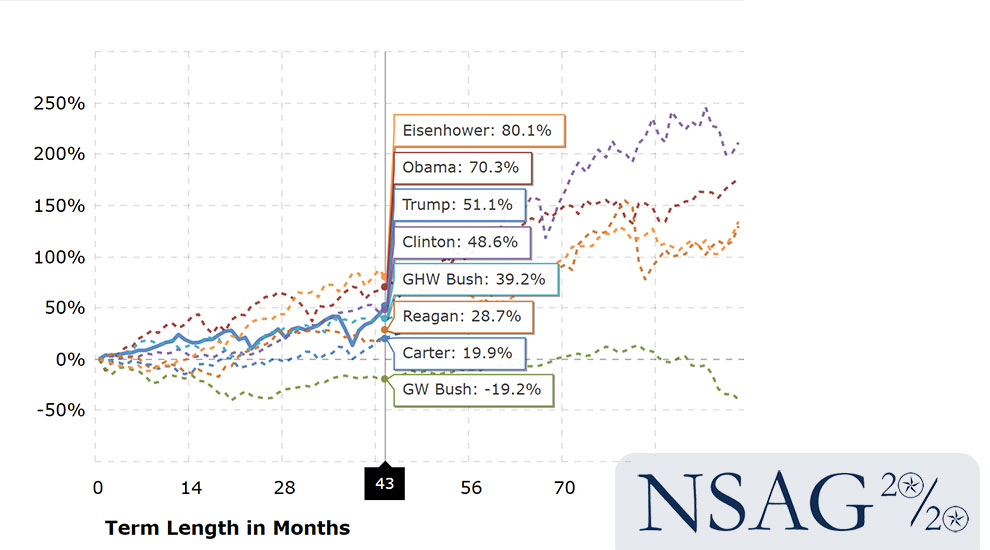
In a search to create and share the historical comparisons we stumbled upon a very simple an interactive chart (compliments of macrotrends.net) that shows the running percentage gain in the S&P 500 by Presidential term. Each series begins in the month of inauguration and runs to the end of the term. The y-axis shows the total percentage increase or decrease in the S&P 500 and the x-axis shows the term length in months. Click on any president’s name in the legend to add or remove the graph lines. Click HERE or on the picture below to see if you can make a case that one party has more influential on the market than others.
We understand that there are many factors that play into or out of favor for each economic period under each President. And while past performance is not indicative of future returns, we will continue let fundamentals drive our investment process, not just a political party.
Don’t let your emotion wreck your returns
With our education has helped guide many clients through and away from many tough investing decisions. Discussions around “panic selling” earlier this year or trying to call a market top this summer are two perfect examples of frequent topics brought up by clients. Life is emotional, but it has no place in investing. North Star welcomes these difficult conversations as we navigate the a very confusing market and economy.
“The investor’s chief problem – and his worst enemy – is likely to be himself. In the end, how your investments behave is much less important than how you behave.” – Benjamin Graham
Volatility is likely to pickup
Anyone who invested with the “sell in May and go away” strategy is clearly kicking themselves. We are moving from a historically quiet summer period in the market and we have the added complexity of the 2020 Presidential Election. We are working with clients to consider strategies to help limit downside risk while still participate in any potential upside market appreciation. Furthermore, a Biden victory could bring increased trading in Q4 as investors look to sell winners to lock in gains at the current capital gains rates compared to the potentially much higher ordinary income rates during his Presidency. While investors may take their profits, it doesn’t necessary mean they are going to park their proceeds into cash. It is highly likely that 80%+ of the proceeds may find its way back into the market. Please call us if you would like to discuss this or any other topic further.
Tech’s Q3 Performance has been a dog!
If there has been a reliable trend in the market over the last several years, it has been the leadership of the Technology sector. While there have been days or weeks where tech lags and value rallies, more often than not, it all comes back to tech, especially when the market is rallying. So far this quarter, though, tech hasn’t been leading, and it hasn’t even been playing second fiddle. In fact, Technology finds itself in the unconventional position where it is actually underperforming the S&P 500 quarter to date (QTD)! While sectors like Consumer Discretionary (1276%), Industrials (12.63%), and Materials (11.02%) are all up by double-digit percentages, the Technology sector’s ranking in terms of QTD performance is actually 6th out of 11 at 8.77%. What a dog.
Record earnings season
Analysts were rapidly increasing earnings estimates leading up to earnings season. Normally when that happens, stocks have trouble performing well during earnings season because the expectations bar has been set higher. This season, even with analyst estimates on the rise in the four weeks leading up to the start of the reporting period, companies managed to beat bottom-line EPS estimates at the highest rate in the history of our database going back to 1999.
- 76% of companies reported stronger-than-expected EPS numbers this season, which eclipsed the prior record high of 73% seen during the Q3 2006 reporting period.
- While the bottom-line EPS beat rate set a record this season, the top-line revenue (sales) beat rate came in at 66%. This was not a record, but it was the highest revenue beat rate seen since the Q2 2018 earnings season.
Forward guidance numbers were even more impressive than the backwards looking EPS beat rate that set a record this season. Our guidance spread measures the difference between the percentage of companies raising guidance and lowering guidance. The guidance spread this season was +9 (12% raised guidance, 3% lowered guidance). That’s easily a record high and nearly double the prior high seen in the Q1 2004 earnings season!
With beat rates and guidance so ridiculously strong this season, it unfortunately sets the bar extremely high for the last few months of 2020. Continuing to beat expectations at a high rate is not out of the question, but we think it will be much more difficult for companies to impress when Q3 numbers start coming in late September/early October.
Biden’s tax increase for Social Security
In April 2020, the Social Security Administration said the funds were projected to run out in 2035, at which point 79% of benefits would be payable.
Biden has a proposal to help shore up Social Security that many Americans can get behind (and a few will object to).
In 2020, all earned income (wages and salary, but not investment income) between $0.01 and $137,700 is subject to the 12.4% payroll tax that funds Social Security. Approximately 94% of workers will pay into Social Security this year with every dollar they earn. Comparatively, the other 6% of workers who’ll make more than $137,700 in 2020 will see their income above $137,700 exempted from Social Security’s payroll tax. Between 1983 and 2016, the amount of earnings exempted ballooned from a little over $300 billion to $1.2 trillion.
Under the Biden tax plan, a “doughnut hole” would be created between $137,700 and $400,000, where this 0% taxation exemption would remain in place. However, for earned income above $400,000, the 12.4% payroll tax would be reinstated. It’s estimated this would raise between $800 billion to $1 trillion over the next decade.
The flip side of the additional revenue to shore up the system could be lost due to additional benefits Biden is considering which may include:
- Increased benefits for those who have received Social Security for 20+ years.
- A minimum benefit of 125% of the poverty level for those who have worked for 30+ years.
- Increased widow benefits to 120% of their deceased spouse’s benefit.
- Elimination of the windfall prevision.
Even if the additional revenue plan is put into place without additional benefits, we expect other small changes will still be needed to shore up the Social Security system. Our expectation remains that workers less than age 55 may have their benefits reduced, their retirement age pushed back or both. While it not impossible, the Government is less likely to change benefits for workers who are within less than 10yrs of their current full retirement age.
Our GARP process has not waivered
In 18+ years of investing and working, I have seen a lot. It is the collection of these experiences combined with the knowledge passed on from some of the best investment managers has forged the investment process that we utilize with our clients today. It is not what happens over the next one or two months. Maybe not even the next one or two years. However, what we are going to do for our clients over the next five, seven, ten or even twenty years will allow for them to enjoy a comfortable retirement. We don’t want retirees to be forced to work part-time or be forced to sell at a market low.
If we follow our rules-based strategy, we should be able to continue to achieve growth while mitigating the downside risk. Nothing we do at North Star is based on headlines or emotions. We focus on economic data, personal family objectives and mathematics to drive our “Growth At a Reasonable Risk” process. We follow our strategy now matter what happens. Managing risk and volatility is the foundation of our approach to wealth management. As far as client satisfaction is concerned – the referrals speak for themselves. This year was one of the most challenging markets to read and we are pleased that our process and intuition has once again been correct. Did we go “all-in” on the next stock that increased 100%? No. But, that is not what our clients have asked us to do.
The election is also going to present its own challenges. We will continue our process and we are working on a few great educational surprises for the next two months.
Where will the equity markets go next?
As we wrote about last month, cases of Covid-19 are getting better in the US and the number of new deaths continues to fall. However, we expect a slight uptick as we send kids back to school. This moderate “school” increase would be consistent with what other counties have experience in Europe recently. If we can follow Europe’s trend, we should not see another significant impact to the economy or market.
As we sit at new market highs, our vision and communication has not changed since 2010. We still believe we are in a secular bull market, which typically lasts around 15 years. Historically, it is not uncommon to have a bear market (which essentially occurred in Q4 of 2018) or even a brief recession (which we may be experiencing right now) during a secular bull market. Markets will trade on fear or momentum from time-to-time. In-between earnings reports, the markets may even trade on a single data point (like the new cases and death count of COVID-19). Eventually, the markets return to trading on fundamentals. We believe that fundamentals are starting to return. But the gains will be clouded until we get the first (or second) approved vaccine. Meanwhile the Fed and Treasury are doing a tremendous job of providing a financial bridge to get through the next few months.
We are passionately devoted to our clients’ families and portfolios. Let us know if you know somebody who would benefit from discovering the North Star difference, or if you just need a few minutes to talk.
As a small business, our staff appreciates your continued trust and support as we all work through these stressful and trying times for our country and world.