


Each month we ask clients to spend a few minutes reading through our newsletter with the goal of raising their investor IQ. December’s Timely Topics commentary wraps up 2023 with an analysis of market seasonality and a review of inflation’s impact on popular gifts.
- Market seasonality
- Market internals improving?
- Holiday shopping
- The gift of time
- NSAG news
- Where will the equity markets go next?
Market seasonality
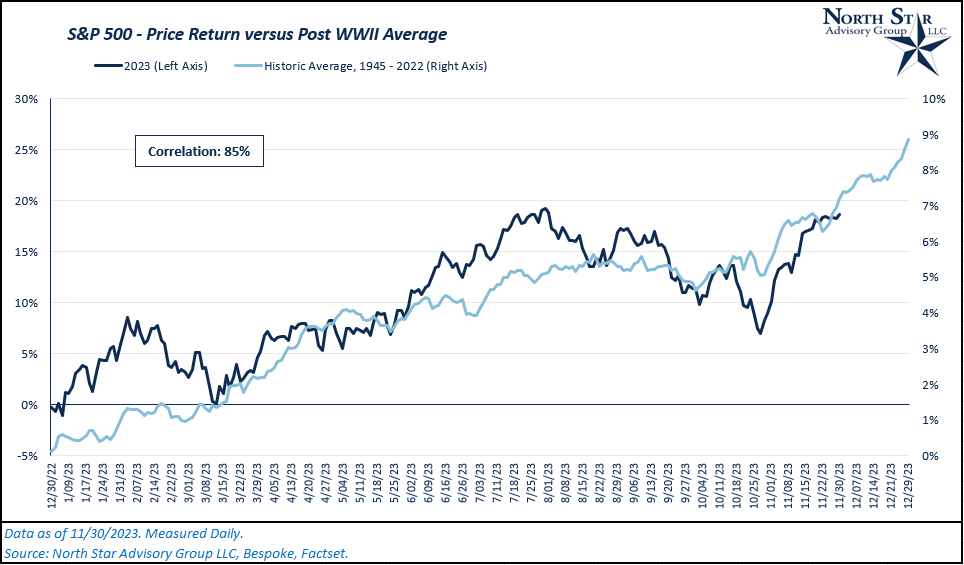
Coming out of 2022’s bear market for both stocks and bonds, the stock market rallied in 2023 with stronger returns compared to the annual average for stocks post World War II, measured by the S&P 500. While 2023’s price return for the S&P 500 has exceeded its annual average, it has closely followed the typical seasonal trend as seen in the chart below, “S&P 500 – Price Return versus Post WWII Average”. Through 11/30/2023, 2023’s string of daily returns has been strongly correlated with the historic seasonal trend (85%).
Historically, the 4th Quarter (October, November, and December) has been the strongest quarter for stocks. Although this year’s returns have matched historic seasonal trends well, October appeared to be an outlier as the S&P 500 was down 2.2% in the month, versus a historic average of +1.3%. Despite this outlier month, November’s rally (+9.8% as of 11/30/2023) has outpaced the historic average for the month, seemingly making up for October’s lackluster returns. On top of the seasonal divergence in October, the S&P 500 was at short-term oversold levels one month ago. These combined factors have likely led to the excess rally this month.
Looking ahead, December is another month that has historically had positive returns for stocks. If we can continue to follow this path, we could see the rally in stocks continue through the end of 2023.
Market internals improving?
While the S&P 500 is up 19% year-to-date (as of 11/30/2023), many investors have discussed the narrowness of this year’s rally. As of 10/30/2023, the S&P 500’s top 10 stocks by index weight accounted for ~69% of the index’s year-to-date return. Now, one month later, those same 10 names only account for ~47% of the index’s year-to-date performance. How has this participation number changed so drastically in just one month? The November rally for the S&P 500 has broadened out and been driven by smaller companies within the index. This can potentially be a good sign for a healthier long-term uptrend in the equity markets if the theme continues.
Other signs that show improving market internals and a broadening of performance include strong relative performance in small cap stocks, the number of stocks trading above their respective moving averages, and improved market breadth.
Since 11/09/2023, U.S. small cap stocks are up ~6% while U.S. large cap stocks are up ~4%. A large driver of this performance came in part due to falling treasury yields as recent inflation data came in lighter than expected. Historically, small caps are more sensitive to changes in interest rates.
A popular indicator for market breadth is the Advance/Decline line (“A/D” line). This indicator takes the number of stocks within an index that are advancing and subtracts the number of stocks that are declining in that same index. This metric is measured daily, and each daily value is combined cumulatively over a given time period. A rise in the A/D line indicates improving market breadth. Over the past month, the A/D line is at a net positive value of 2,259. For reference, the average 1-month change in the A/D when breadth is positive is ~1,000 over the past 10 years.
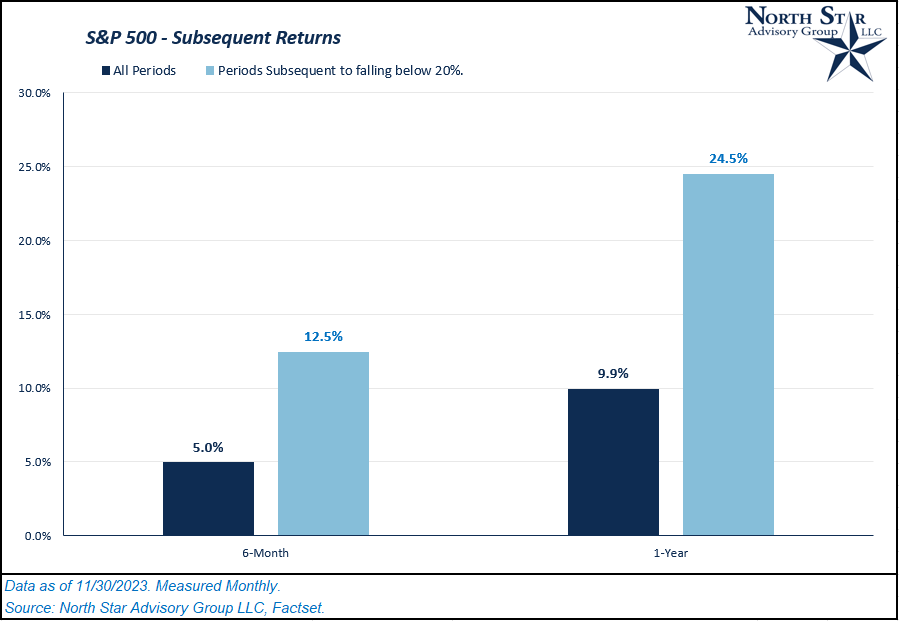
Over the past month, the % of stocks within the S&P 500 that are trading above their 50-day moving average increased from just 14% to 77%. Digging deeper, we examined monthly data for this metric over the past 10 years. We measured the subsequent 6-month and 1-year price change for the S&P 500 after the % of stocks above their 50-day moving average fell below 20%. In the chart titled, “S&P 500 Returns,” you’ll see that historically, these periods produced stronger returns over the next 6-months and 1-year periods on average in comparison to all observed periods over the past 10 years.
.png)
.png)
Holiday shopping
Now that we are fully into the holiday season, gift shopping for families is ready to kick-off and many families have likely already begun their shopping. As we all know, 2022 was a year of inflationary pressure, partly caused by supply chain shocks in 2021 and early 2022. Companies began doing anything they could to increase their inventory levels with the hopes of catching up to consumer demand. Eventually, we saw many companies far surpass their optimal inventory levels, which subsequently put downward pressure on prices. This theme was far more prevalent for goods relative to services.
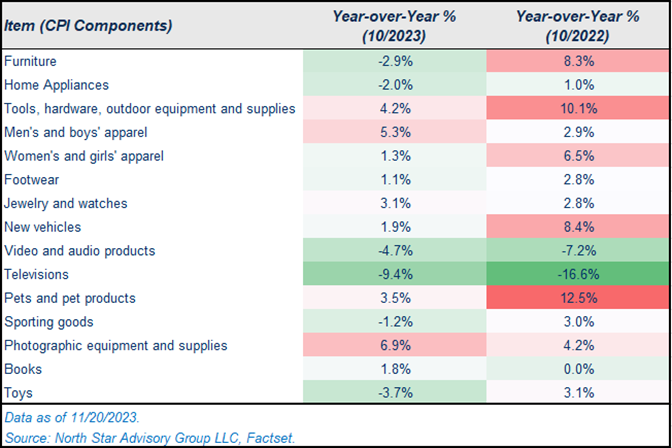
In the table below, we’ve broken down the year-over-year price changes for various components of the CPI index. These are likely the areas that you and your family will be shopping in this holiday season.
In October 2023, TVs, video products, toys, furniture, home appliances, and sporting goods all experienced price deflation compared to October 2022. Over the same time period, jewelry/watches, pets, men’s apparel, and tools/hardware were some of the areas with larger continued price increases.
The gift of time
While NSAG continually monitors the markets to discover opportunities for our clients, we firmly believe that time is the biggest gift a person can have when it comes to investing. As an investor’s time horizon increases, their biggest risk transitions from volatility (standard deviation) to failure to meet required returns. When allocating portfolios with long-term time horizons, it is important to continue to keep this in mind during periods of market volatility. In the table below, we’ve calculated some key statistics for broad asset classes over the past 35 years.
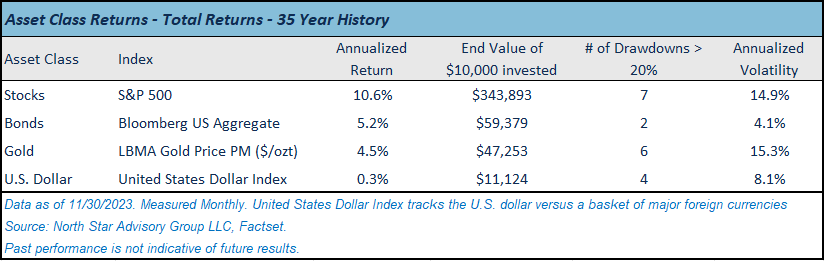
As we mentioned above, an investor’s biggest risk shifts from volatility to failure to meet required returns as the investor’s time horizon increases. To display this, let’s compare stocks and bonds in the table above. Based on drawdowns and volatility, stocks are riskier in comparison to bonds. Although, if your plan is to hold these investments for decades (35 years in this case), you would have been fine with stomaching the extra volatility in return for double the performance.
NSAG news

We are very pleased to announce that Forrest Kuchling passed the October 2023 Certified Financial PlannerTM (CFP®) exam.
Forrest is now pending approval of his application to become a CFP® certificate holder, which will be achieved after completing two years of mentoring under Mark Kangas.
The continued success of NSAG’s practice and our employees’ passing rate of certifications is a huge credit to the dedication we bring to each and every one of our clients. Cheers Forrest!
More about the CFP designation:
The CFP® certification is the standard of excellence in financial planning. CFP® certification includes testing on cash flow planning, insurance planning, retirement planning, tax planning, investment planning, and estate planning. CFP® professionals meet rigorous education, training and ethical standards, and are committed to serving their clients' best interests today to prepare them for a more secure tomorrow.
Where will the equity markets go next?
We have closed out November and are in the home stretch of the year. Any investors who exited their diversified portfolios in September or October this year are likely a little disappointed. In November, the S&P 500 posted an 9.8% month-to-date gain. Impressively, that ranks as the 36th best month since 1928 and the 17th strongest of the past 50 years. November also finished with the strongest gain since November 2020 when the S&P 500 rallied 10.75%. Prior to that, April 2020 (+12.68%), October 2011 (+10.77%), April 2009 (+9.39%), March 2000 (+9.67%), and December 1991 (+11.16%) were the only monthly gains as large, if not larger, since the start of the 1990s.
We are passionately devoted to our clients' families and portfolios. Contact us if you know somebody who would benefit from discovering the North Star difference, or if you just need a few minutes to talk. As a small business, our staff appreciates your continued trust and support.
Please continue to send in your questions and see if yours get featured in next month’s Timely Topics.
Best regards,


Mark Kangas, CFP®
CEO, Investment Advisor Representative