

Each month we ask clients to spend a few minutes reading through our newsletter with the goal of raising their investor IQ. As the economy continues to strengthen, we focus August’s Timely Topics commentary on recent client questions and a better understanding of inflation expectations.
- Sell at next market high?
- Inflation and Fed update
- Gold’s role in a portfolio and digital dollars
- Index concentration
- Where will the equity markets go next?
Should I sell once the market makes a new high?
Recently, a client inquired about selling their assets once the market reaches a new all-time high. Let’s dive into the numbers together to better understand why historically speaking, this strategy has not turned out to be a profitable decision.
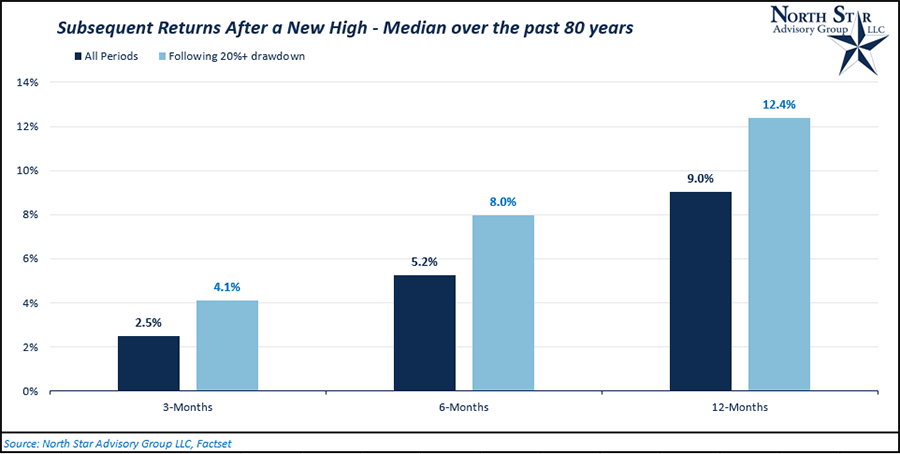
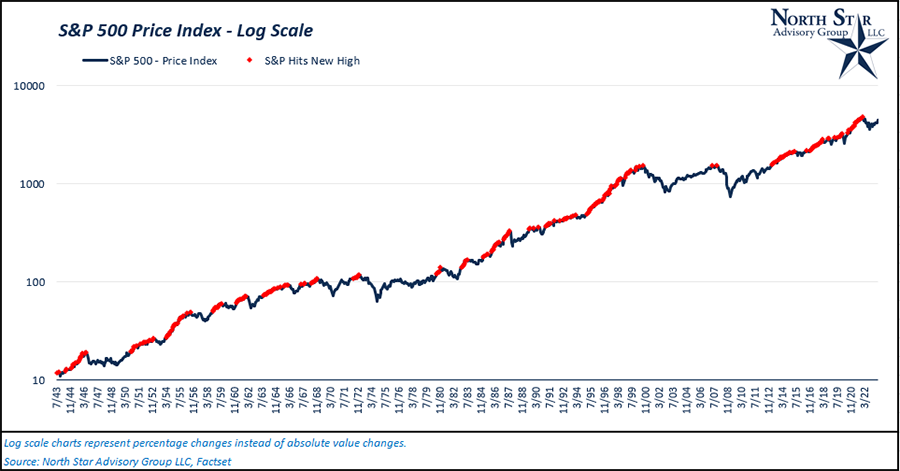
To keep things simple, we analyzed monthly price data over the past 80 years for the S&P 500. Each month over the past 80 years (960 months), the index had reached a new high by the end of that month 242 times. Following a new high, the index had a median price return of 2.5%, 5.2%, and 9.0% over the subsequent 3-month, 6-month, and 12-month time periods, respectively.
If a new high occurred within 18 months after a bear market (bear market = 20% or greater drawdown from peak to trough), the subsequent price returns following that new high were 4.1%, 8.0%, and 12.4% for 3-month, 6-month, and 12-month time periods, respectively. In the drawdown scenario, there were 33 occurrences (months). While past performance is not indicative of future results, the data is against the strategy of selling assets after the market reaches a new high.
Inflation and Fed update
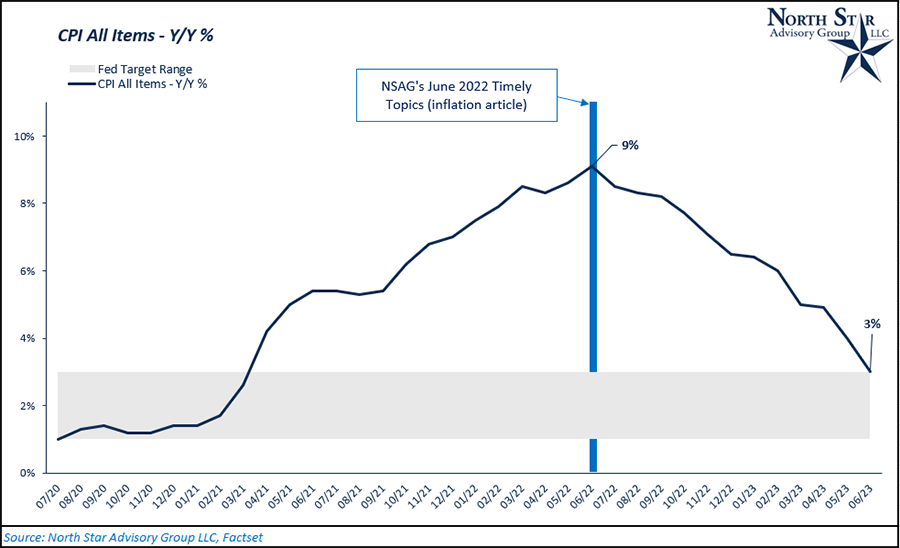
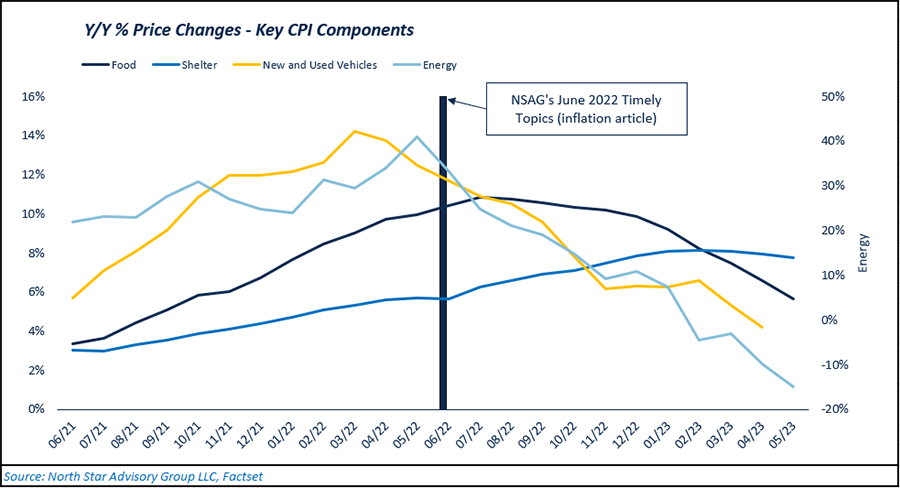
For the month of June 2023, headline inflation (CPI All Items) came in at 3% when measured versus one year ago. Although the federal reserve has a target inflation rate of 2%, their preferred range is typically 2% with a +/- 1% variance. So, June’s inflation data is right on the federal reserve’s upper bound target. As you can see in the chart below, headline inflation peaked in June of 2022 (9.1%) and has since had a consistent disinflation towards the Fed’s target. A big contributor to this disinflation trend has been the basing effect. You may recall that NSAG wrote about the basing effect in Timely Topic’s June 2022 edition. We ran a couple hypothetical scenarios on potential inflation paths. By holding auto and energy prices flat, we estimated that headline inflation would fall to 3% by March 2023. The point of this exercise was to show that the prices of other less volatile components of the CPI index were also slowing.
Since June 2022, we’ve seen disinflation in prices for food, vehicles, and even deflation (negative price change) for energy. Shelter has been the only major CPI component yet to show disinflation, although prices have not continued to accelerate over the past couple of months.
While we’ve continued to have a disinflationary trend since June 2022, the Federal Reserve continues to talk hawkish, and the market is currently pricing for one more rate hike in 2023, as of 7/26/2023. On 7/26/2023, the Federal Reserve raised its target policy rate by 0.25% (This implies a range of 5.25% - 5.50%). There is a ~20% probability of a 0.25% hike for September’s Federal Reserve’s meeting (7/26/2023). Rate hikes from the Fed have been one of the contributing factors to slowing inflation.
Gold’s roll in a portfolio and digital dollars
Clients have continued to inquire about the U.S. Dollar, the Federal Reserve’s new FedNow digital dollar program, and various other U.S. Dollar alternatives, such as gold.
The Federal Reserve announced that the FedNow Service will start operating in July 2023. This new program will create a digital form of central bank money known as central bank digital currency (CBDC). In the long term, we expect to see a compression of banking fees with slightly faster transactions. Foreign transactions for people, companies and banks will also get much faster and cheaper. The winners are likely going to be the big banks. The recent regional bank issues reinforce that large well-established and well-capitalized banks need to help guide the ship financially. The large banks were already part of the Federal Reserve’s announcement of the 57 early adopter organizations. Yes, big brother will be able to watch your transactions better. If we honestly look at our current digital footprint, most Americans are virtually tracked everywhere already. Even if you are someone who utilizes technology less, you are likely being tracked more than you may think. Concerns over the federal government, privacy and currency devaluations have led investors to crypto currencies and gold.
While Bitcoin has gained in value this year, it has failed in its ability to store value as it still remains approximately 50% below its all-time high. Crypto currencies were once thought to be not traceable or trackable, but they are now being recovered and confiscated in record hauls by law enforcement agencies.
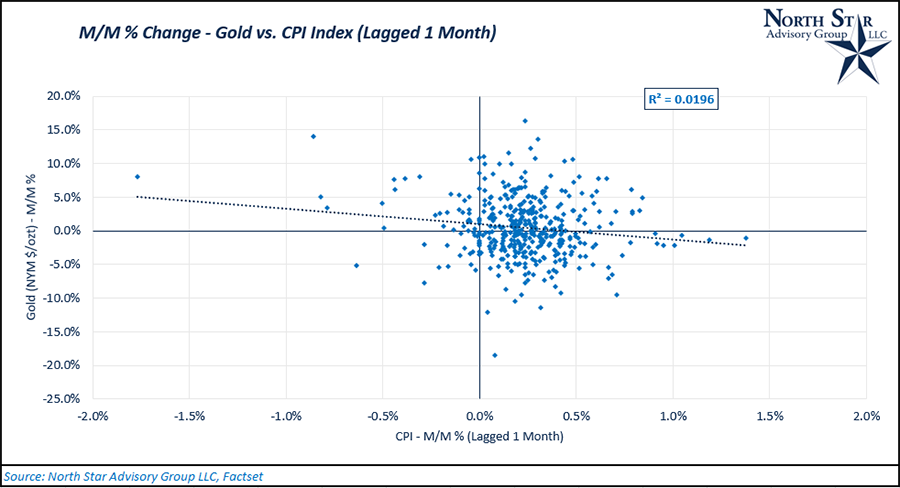
Gold, on the other hand, has often been viewed by many as an inflation hedge. When comparing monthly percentage changes for both gold prices and the CPI Index (See “M/M % Change – gold vs. CPI Index”), we can see that gold actually has a low correlation with inflation. Nominal gold returns do not strongly track inflation, contrary to popular belief. In fact, historically, gold has acted more as a safe haven asset, performing better during times of economic and financial stress. During such times of stress, money tends to flow into safe haven assets, such as cash instruments, short-term treasuries, and precious metals, while money flows out of risky assets, such as stocks and high yield bonds. This causes an inverse correlation between risky assets and safe haven assets during times of financial stress.
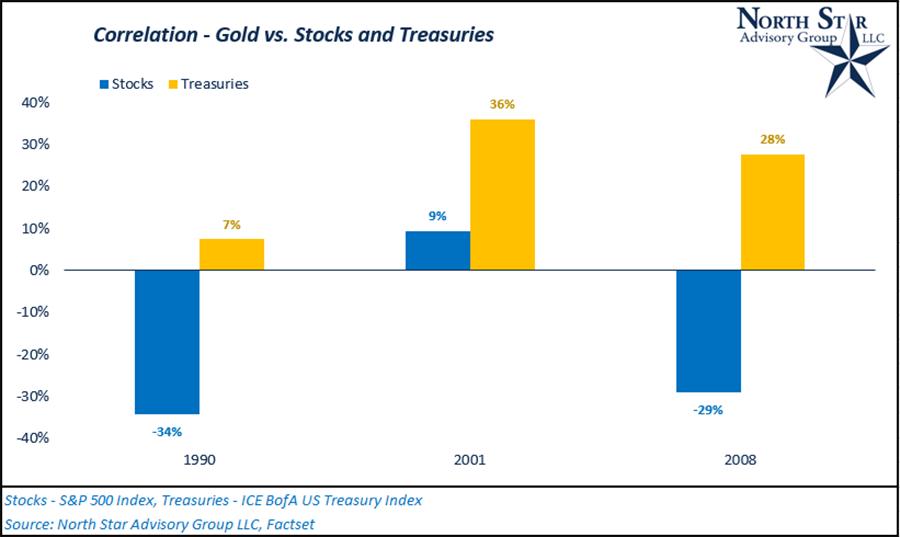
To illustrate this, we’ve included a table that shows gold’s long-term correlation with both stocks (risky assets) and treasuries (safe-haven assets) compared to the short-term correlations during the past 3 recessions (excluding COVID-19 pandemic due to the unusual short length of the recession). Over the long-run, gold and stocks virtually have approximate zero correlation, while gold and treasuries are ~20% correlated. In 1990 and 2008, gold and stock’s correlation fell further from its long run average. During 2001 and 2008, gold and treasuries became more correlated compared to their long-run average. Overall, this data shows us that gold tends to be a poor inflation hedge, and a decent asset for downside protection.
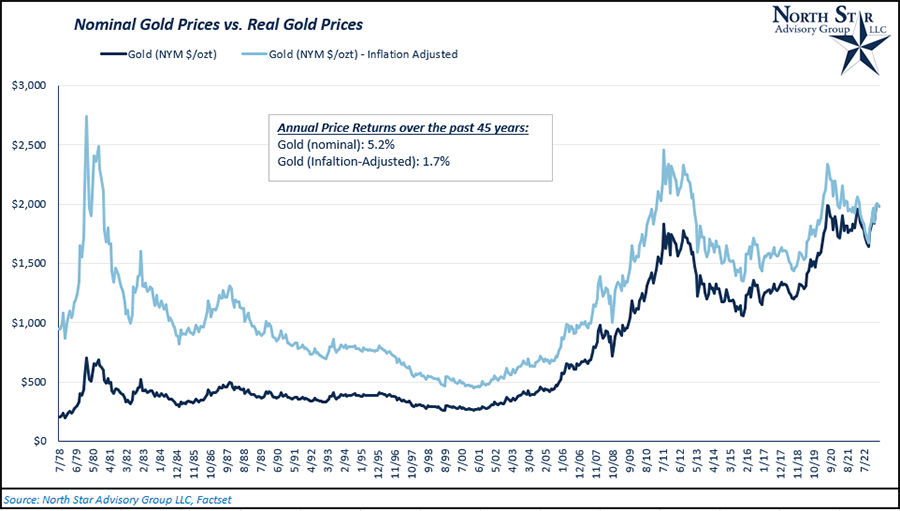
How has gold faired as a long-term investment in and of itself? In the chart, “Nominal Gold Returns vs. Real Gold Returns”, we compare the actual price of gold to its inflation-adjusted price over the past 45 years. Gold provided a 5.2% average annualized return over that same time period. In real terms (inflation adjusted), the return drops to 1.7%.
Index concentration
Many clients have inquired about active versus passive management within the equity markets. While these two strategies have many different pros and cons, a key topic of discussion within this debate is currently focused on index concentration. Currently, the S&P 500’s top 10 holdings represent around 30% of the entire index as of 7/15/2023. The S&P 500 is currently up ~20% year-to-date and the top 10 holdings have contributed ~46% of the total year-to-date return as of 7/15/2023. A similar concentration trend can also currently be found within many growth indices as mega-cap growth stocks have dominated the market throughout the majority of 2023.
As these mega-cap companies’ market caps continue to grow, their influence on index returns (both positive and negative) continues to grow. A herding and momentum effect can also take place as passive managers continue to increase their holdings within the few names concentrated at the top. The impact of this could mean lower relative returns and higher relative risk moving forward for the market-cap weighted index. We will dig further into the data over the next couple paragraphs.
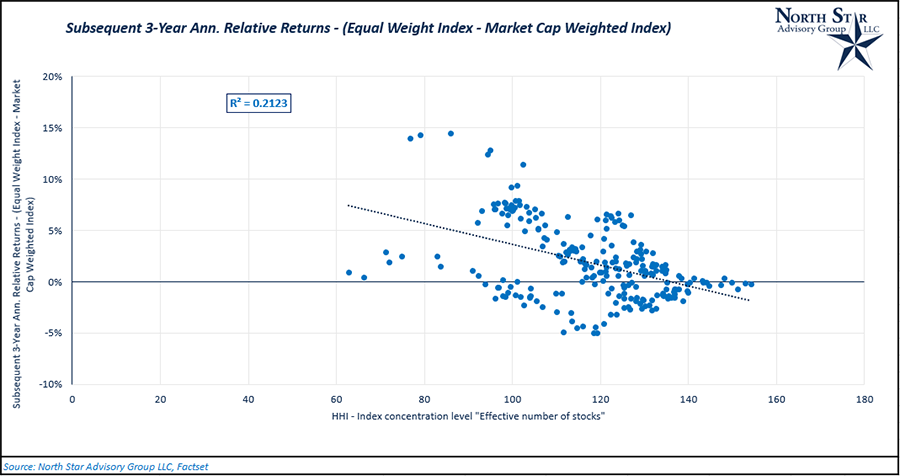
The Herfindahl–Hirschman index (HHI) is a metric that has commonly been used to measure competitiveness within an industry based on market-share concentration (revenue share %) of firms within an industry. The HHI can also be applied to market indexes and portfolios with the goal of measuring concentration levels. Currently, the S&P 500’s HHI is at 54. This means the index is effectively diversified between 54 stocks, despite actually having 506 constituents. 53 is the 20-year low, meaning the index is right at its 20-year high concentration level. To analyze the return impact from concentration, we regressed the HHI versus the relative return difference of the S&P 500 Equal Weight Index and the S&P 500 Market-Cap Weighted Index. Historically, the S&P 500 Equal Weight Index tends to outperform after the market-cap index becomes highly concentrated. Going forward, this could point to a “broadening out” of the current market rally away from the top names within the major indices. NSAG is not alone in its concern over index concentration. On 7/25/2023, the Nasdaq 100 Index completed a “special rebalance” outside its normal rebalance cadence. By mandate, the index cannot have more than 38.5% of its assets concentrated in the top 5 names. Prior to this year’s special rebalance, the top 5 names accounted for 45% of the index.
Where will the equity markets go next?
The dark clouds looming over the economy are starting to clear. Clearer skies are causing investors, chief investment officers and economists to turn more positive. We touched on this last month when we noted that, “The Consumer Confidence report ended the streak of net negative readings in bullish sentiment at 17 months! You read that right, the S&P 500 has gained ~20% since the October 2022 lows and now investors are starting to get slightly bullish.” We expect receding fear and growing optimism will likely lead to continued expansion of the economy and equity markets. That being said, the parts of the market have come a long way quickly.
Let’s take a look at two notable shifts in sentiment. First from Mike Wilson and the second from the National Association for Business Economics.
Mike Wilson, Chief U.S. Equity Strategist & Chief Investment Officer at Morgan Stanley issued a rare Wall Street apology in late July 2023 letter to Morgan Stanley clients.
- "We were wrong. 2023 has been a story of higher valuations than we expected amid falling inflation and cost cutting,” Wilson wrote in the letter.
National Association for Business Economics’ (NABE) July 2023 survey panel sees an economy of rising sales and improving profits, with lower materials costs and stabilizing wages. The NABE provided the following highlights from their survey:
- Results of the survey reflect an economy of rising sales and profits, as material costs decline and stabilizing wages prove less challenging.
- A majority of panelists are more confident about the economy over the next year, as they see the probability of a recession diminishing.
- Respondents report continued improvement in sales at their firms over the past three months compared to the previous three. The NRI for sales—the percentage of panelists reporting rising sales minus the percentage reporting falling sales—over the past three months rose to 33 from 30 in the April 2023 survey. The forward-looking NRI rose to 38 from 25 in the April survey, indicating growing expectations for sales in the next three months, as the percent of respondents expecting sales to rise increased and those expecting sales to fall decreased.
- Panelists also report continued improvement in profit margins at their firms in Q2 2023. The NRI for profits is 0, up from the previous reading of -8. This is the first non-negative result after four consecutive surveys reporting negative NRIs. The forward-looking NRI rose to 6 from -6 in the previous survey, also the first non-negative result after four consecutive surveys with negative results.
- The NRI for prices charged rose to 45 from 34 in the April survey, and the third highest reading in survey history. Almost half of respondents, 49%, report prices rose in Q2 2023, up from 40% in the April survey. The forward-looking NRI for prices rose to 35 from 31, as the share of panelists expecting prices to rise in the next three months increased, and the share expecting them to fall declined.
- The NRI for materials costs decreased to 43 from 50 in the April survey and down 33 points from the record high of 76 in the July 2022 survey. The share of panelists reporting falling material costs in Q2 2023 increased to 13% compared to 7% in the April survey, and the share reporting rising material costs decreased to 55% from 57%. The forward-looking NRI fell to 20 from 37 in the April survey, as the share of respondents expecting material costs to fall over the next three months increased to 23% from 7% in the previous survey.
- For the first time since 2021, a majority of respondents (53%) report that wages at their firms were unchanged in Q2 2023, while 47% of respondents report rising wages—significantly lower than the 63% in the April survey.
- Almost three-quarters of panelists (71%) report that the probability of the U.S. entering a recession in the next 12 months is 50% or less.
Finally, the market’s recent swing is a perfect example of why we continue to encourage clients to stay properly diversified as market volatility can be swift in both directions. Last month’s winners could prove to be next month’s laggers as rotation between stocks, sectors or countries occurs. While the NASDAQ led the charge earlier this year, the Dow just completed a 13-day win streak in July 2023 which ties 1987’s streak. During 1987’s streak the Dow gained 11% compared to 2023’s 5.3% gain. Following each of the five prior 11-day winning streaks, the Dow was higher three and six months later all five times.
We are passionately devoted to our clients' families and portfolios. Contact us if you know somebody who would benefit from discovering the North Star difference, or if you just need a few minutes to talk. As a small business, our staff appreciates your continued trust and support.
Please continue to send in your questions and see if yours get featured in next month’s Timely Topics.
Best regards,


Mark Kangas, CFP®
CEO, Investment Advisor Representative