


Each month we ask clients to spend a few minutes reading through our newsletter with the goal of raising their investor IQ. As we celebrate the Fourth of July, we focus our Timely Topics commentary on a better understanding of the new bull market.
- Overbought reversal or new trend?
- Economic indicators
- Fourth of July BBQ deflation
- New bull market
- NSAG News
- Where will the equity markets go next?
Overbought reversal or new trend?
At the mid-point of the 2023 calendar year, we’ve seen broad market rallies across various market segments in both the equity and fixed income markets. Equities have been particularly strong with U.S. large cap, U.S. small cap, global equities excluding U.S., and emerging markets returning 15%, 5.8%, 10.7%, and 5.7%, respectively year-to-date as of 6/27/2023. An outlier in broad equity performance has been large cap growth (+26.7% year-to-date), driven primarily by artificial intelligence development and the headline news surrounding its development. Growth equities were one of the worst performers in 2022, and we were seeing a counter-trend rally form in early 2023 before the AI buzz began heating up.
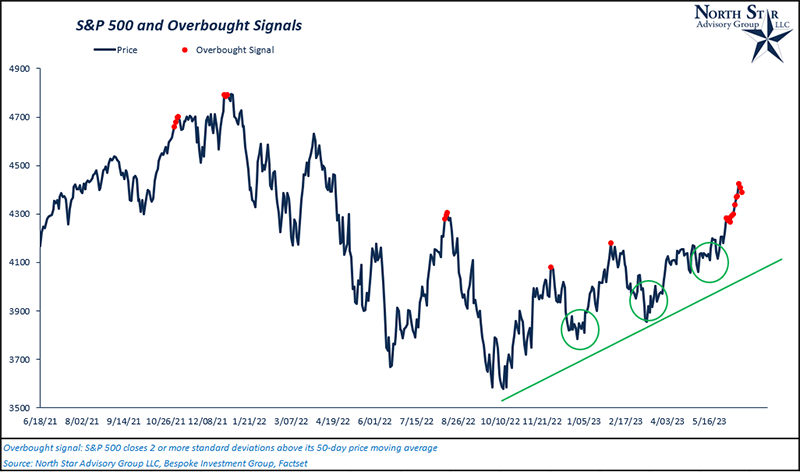
As these broad market rallies have sustained, equity markets have become overbought in the short-term, with U.S. large cap equity becoming one of the most overbought equity segments. In mid-late June, we witnessed various overbought signals for U.S. large cap (S&P 500). What do these overbought signals mean for future performance? For reference, the overbought signal that NSAG is using triggers any time that the S&P 500 closes two or more standard deviations above its 50-day moving average. This signal was triggered every trading day from 6/02/2023 to 6/20/2023 (12 consecutive days). This signal peaked on 6/15/2023 when we were 2.97 standard deviations above the 50-day moving average.
In 2022, we saw this signal trigger at the height of various intra-year rallies. In the heat of a federal reserve tightening cycle and record inflation data, these signals typically led to a reversal of each rally, sending the market back toward its lows (See chart: “S&P 500 and Overbought Signals”). We also saw this occurrence in February 2023, although regional banking contagion fears were the primary driver of this rally’s reversal.
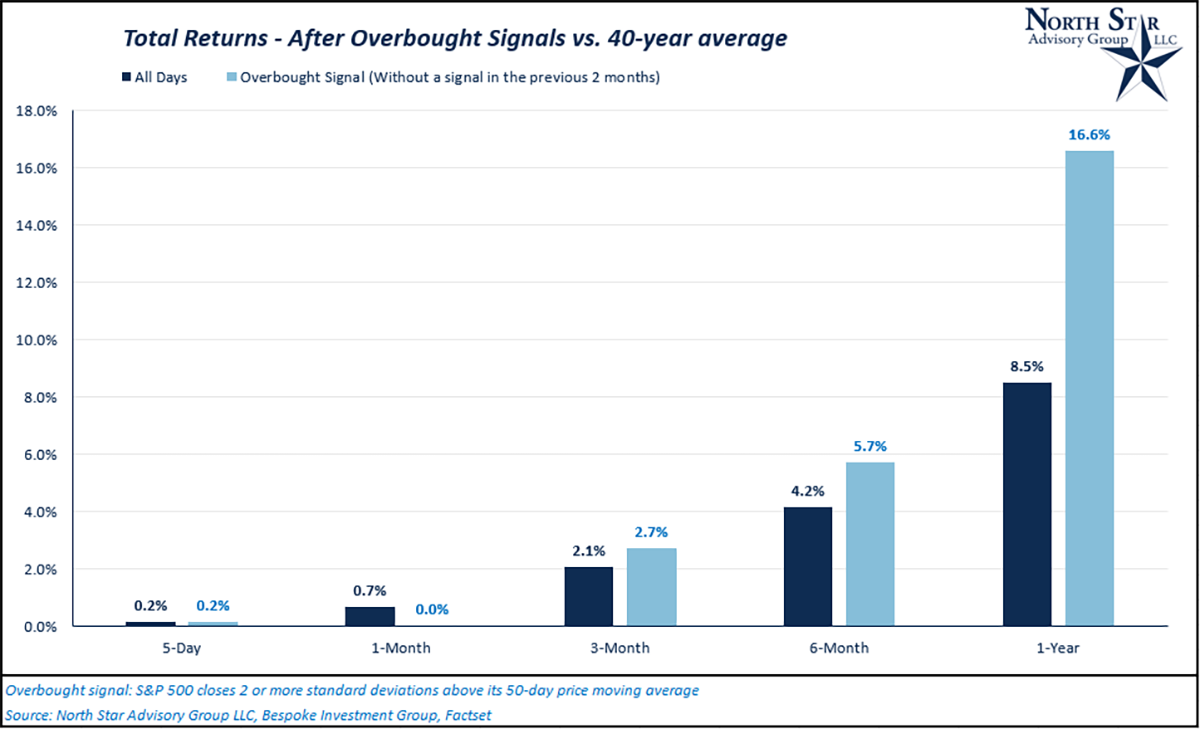
Do these overbought signals historically lead to reversals? To answer, we analyzed median short-term and long-term subsequent returns following an overbought signal in comparison to median return values for all days over the past 40 years. In looking at the chart, “Total Returns – After Overbought Signals vs. 40-Year average,” you’ll see these signals have generally led to a sustained outperformance in the intermediate- and long-term (6-months and 1-year) vs. historical average returns.
Given that we’ve made various “higher lows” (indicated two charts above with green circles) since the market bottomed in October 2022, we believe that these recent overbought signals are likely conveying the markets positive outlook for the economy, which could be showing the market is ready for a longer sustained up-trend.
Just like past performance not indicative of future results, overbought signals do not immediately mean you should sell.
Economic indicators are showing better times maybe ahead
Following up on the outro to last month’s Timely Topics, NSAG dives further into the current macroeconomic data trends in 2023 from the market’s lows in October 2022. For 2023, macroeconomic indicators are showing that the economy was weakening in the recent past, is currently stabilizing, and appears to be gaining momentum in the near future.
To get to this summary, NSAG analyzed three primary types of economic indicators: leading, coincident, and lagging. Leading indicators measure where the economy is headed, coincident indicators measure where the economy is currently, and lagging indicators are measures reported after the respective business trend has already occurred.
As the equity markets are forward looking, the S&P 500 is actually one of the more widely used leading indicators. With that being said, we will compare the S&P 500 trend with housing starts, durable new orders, and consumer confidence, as they are all key leading indicators. Additionally, we analyze coincident indicators including non-farm payrolls, industrial production, average hours worked, and retail sales. Lastly, we analyze lagging indicators including unemployment rate, CPI inflation, average hourly earnings, and capacity utilization.
All four leading indicators have been trending up (S&P 500, Housing Starts, Consumer Confidence* and Durable New Orders). Broadly, leading indicators are pointing towards a continued economic recovery looking forward. Coincident indicators are neutral – with the exception of non-farm payrolls increasing, and lagging indicators are mixed. CPI inflation and capacity utilization are down; average hourly earnings have increased; and the unemployment rate has remained relatively flat.
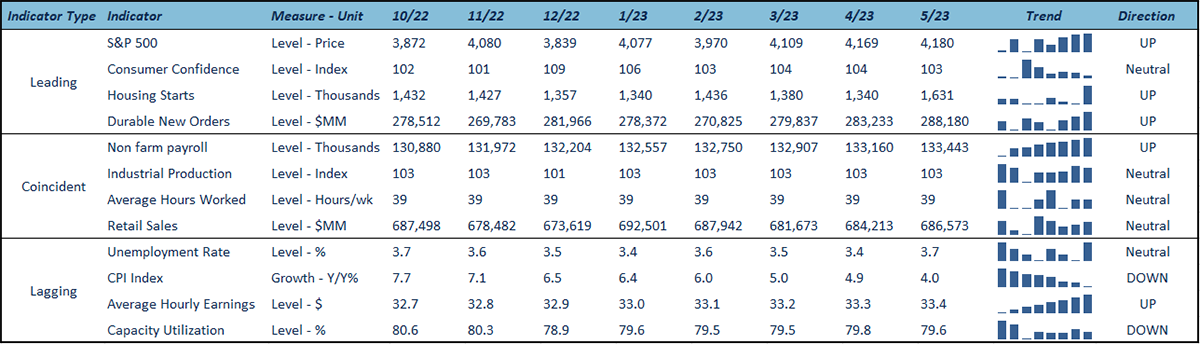
*Important note: The S&P 500 is currently ~4,380 as of 6/27/2023, showing an even further up trend. Additionally, Consumer Confidence hit 109.7 for the month of June, putting the indicator in an upward trend. Although, in the table above, we only show values through the end of May since the remaining economic indicators do not have data released yet for June 2023.
Record oversold conditions creates new bull markets
In October 2022, NSAG wrote about “Record Oversold” conditions in the equity markets. Click HERE to read more.
During that time, we had 9 of the most popular and widely used short-term technical indicators flashing either oversold or extremely oversold conditions for the S&P 500. Those indicators included:
- Relative Strength Index (RSI)
- Moving Average Convergence-Divergence (MACD)
- Breadth
- Advance/Decline Line
- Stochastic Oscillator
- Commodity Channel Index
- Trend Strength (ADX)
- On-Balance Volume
- Parabolic SAR
On 10/12/2022, the S&P 500 closed at 3,577, its lowest low for the calendar year of 2022. Since then, the S&P 500 has returned ~24% to 4,380 on 6/27/2023. From a technical standpoint, a rally of 20% or greater from the low is considered a new bull market. With that being said, the S&P 500’s 24% rally has put the index into a bull market coming off of 2022’s bear market.
- 5 signal overbought
- 2 signal neutral
- 1 signal oversold
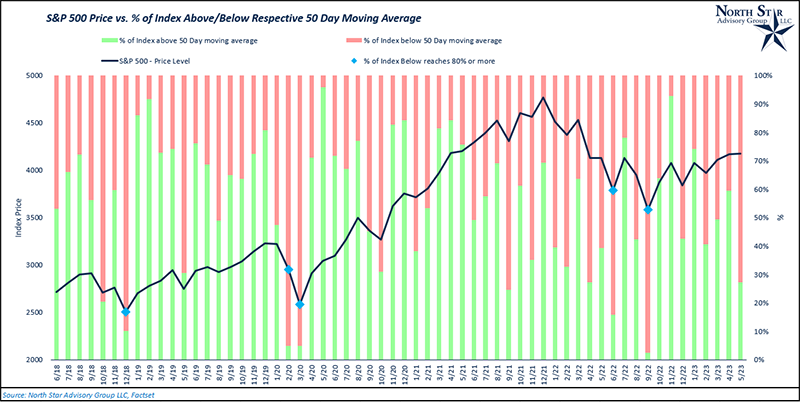
Despite the strong rally, particularly over the past two weeks, we are not showing any extremely overbought conditions according to these 9 short-term indicators. Recall back to our first section this month where we used a different indicator for measuring oversold/overbought conditions. Despite being overbought, the market could be signaling a new sustained long-term uptrend when looking at price action. Although, this doesn’t rule out near-term volatility, and not all of these indicators will be accurate 100% of the time. NSAG continues to monitor technical indicators in both the equity and fixed income markets regularly. Additionally, we always preach to clients that buying opportunities typically come at the moments where you’re hesitant to buy. Psychologically, investors become hesitant to enter the market when stocks are falling, fear is high and sentiment is low. On the other hand, investors tend to enter the market after we’ve experienced a strong recovery. During times of severe market stress and high fear, you’ll typically see broad selloffs across sectors, regardless of stock fundamentals in the short term. In the chart below, we’ve overlayed the S&P 500 Index with the percentage of stocks that are either trading above or below their respective 50-day moving averages. When a high percentage are trading below, this can indicate the equity markets are selling off broadly and market sentiment is low. Using an arbitrary value of 80% over the past 5 years, each time the percentage of the index below its 50-day moving average touched or breached 80%, the market subsequently began a new rally in 3 months or less. In late September 2022, the percentage below 50-day moving average peaked at ~97%.
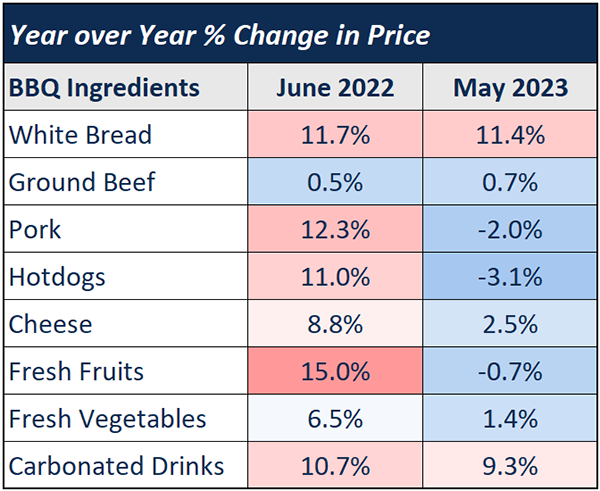
4th of July BBQ deflation
As inflation continues to be a key factor to watch in the markets, it has also become a very popular household topic due to record inflation in 2022. Despite the headlines, you might be shocked to find out that you may be paying less to host a typical 4th of July BBQ for friends and family in 2023 versus 2022! Looking at the table below, we have measured the year over year price increases for popular menu items/ingredients seen at a BBQ. We’ve color coded the highest price change values in red and the lowest price change values in blue. As you can see in the table below, we are starting to see disinflationary (lower positive inflation) and even deflationary (negative price changes) across many of the food items listed when comparing 2023 to 2022.
NSAG News
Lisa Gedeon’s big day is coming up, and we are all excited! On August 26th Lisa and her fiancé Sal Saia will be getting married. Sal is a great guy and we look forward to officially welcoming him to the NSAG family. After all the big planning, Lisa and Sal are going to take a little time off to relax and unwind.
Congratulations to Forrest Kuchling for passing the Ohio Life and Health insurance examination in early June. Forrest passed the exam to help assist NSAG clients with their Life and Health questions.
Where will the equity markets go next?
Mark has been repeatedly reminding the NSAG staff that investor sentiment has been almost as bad as it was in 2008 Global Financial Crisis. Since January 2022, the monthly report on Consumer Confidence from the Conference Board has shown a larger percentage of consumers expecting lower stock prices than higher stock prices. That all changed with the release of the June 27 Consumer Confidence report, which ended the streak of net negative readings in bullish sentiment at 17 months! You read that right, the S&P 500 has gained ~20% since the October 2022 lows and now investors are starting to get slightly bullish.
Since 1987, there have only been three other periods where net bullish sentiment on the part of consumers was negative for nine months or more. The longest streak was 18 months during and coming out of the Financial Crisis, while there were two other nine-month streaks ending in February 2012 and January 2013
Let’s look specifically at the record streak coming out of the Financial Crisis. While the S&P 500 had already rallied 29% off its lows before consumers finally started to turn net bullish on the stock market, in the year following the end of that streak, the S&P 500 rallied an additional 35%. We’re not talking about a large sample size here and past performance is not indicative of future results. But, following the end of past extended streaks of negative consumer sentiment towards equities, there appears to have been a good degree of pent-up demand once those streaks ended.
We are also reminding investors that they have to have patience. As mentioned earlier in our writing this month, the Nasdaq has led the way in performance for 2023. In fact, the Nasdaq has had its third best start to a year since 1972, trailing only 1975 (45.5%) and 1983 (37.1%). Given the big gains this year, you’d think that the percentage of positive days would be higher than most other years. However, only approximately 50% of trading days this year for the Nasdaq have been positive, which ranks 2023 as 30th out of 52 years.
Finally, the Nasdaq’s swing is a perfect example of why we continue to encourage clients to stay properly diversified as market volatility can be swift in both directions.
We are passionately devoted to our clients' families and portfolios. Contact us if you know somebody who would benefit from discovering the North Star difference, or if you just need a few minutes to talk. As a small business, our staff appreciates your continued trust and support.
Please continue to send in your questions and see if yours get featured in next month’s Timely Topics.
Best regards,


Mark Kangas, CFP®
CEO, Investment Advisor Representative