


Each month we ask clients to spend a few minutes reading through our newsletter with the goal of raising their investor IQ. This month we focus on preparing for the new year.
- Positive returns for 2022?
- NSAG’s Macro outlook
- Equity Allocation in a rising rate environment
- New Year’s resolutions
- NSAG Revelation
- Where will the equity markets go next?
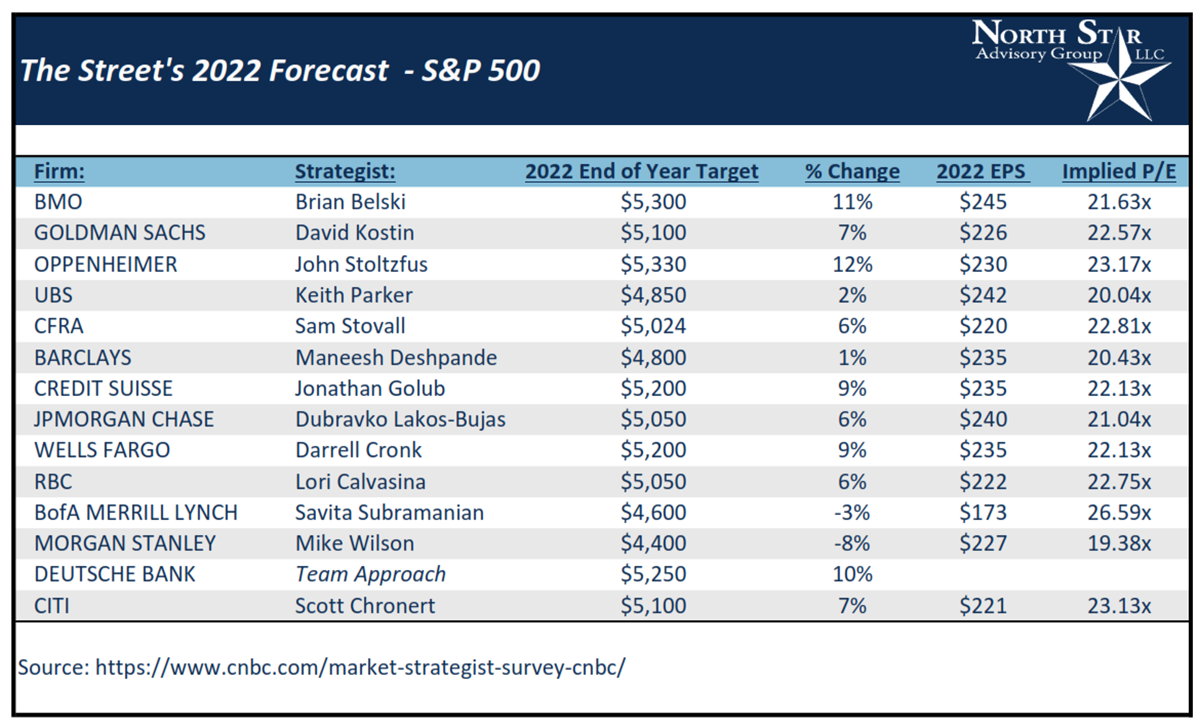
Positive returns for 2022?
45 strategists across Wall Street were polled in early December 2021 on their expectations for the S&P 500’s return in 2022. At that time, they were expecting an approximate 7.5% gain for 2022, however since their forecasts, the S&P 500 finished almost 4% higher in the last few weeks of 2021, closing at 4,759 for the year. The rapid year end growth for the S&P 500 potentially mutes the potential returns considering the average 2022 year-end target of 4,910. Hope is not all lost, 13 of the 14 analysts at top firms underestimated the S&P 500 in 2021.
While estimates are wide, a consensus appears to be brewing across Wall Street that risk assets, such as equities, are favored in 2022 due to:
- Inflation easing from 6% in 2021 to a still-elevated 4.0% inflation rate for 2022
- Unemployment falling further, closer to 4% to favor risk assets
- Supply-chain pressures easing in the second half of the year
- Cash and bonds yielding negative real returns after taking inflation into account
- Expected higher stock volatility in the first few months of the year, followed by a stronger second half
The range of S&P 500 estimates compiled for 2022 span a 20% spread and represent the second widest estimate range in a decade. NSAG views this spread in two important ways. First, stock selection and style will be extremely important in 2022. As we have written about many times over the last few months, we see a growing importance on value stocks and deemphasis of high-priced stocks as interest rates rise. Second, if we dig deeper and look at 14 strategists from the largest firms we find:
- We could continue to see strategists under promise and over deliver. 13 of the 14 strategists underestimated the S&P 500 for 2021; 5 of those 13 underestimated by 6-25%!
- 12 of the 14 are expecting positive returns. The two who are expecting negative returns saw their 2021 forecast underperform by 12-19%.
- 10 of the 14 are expecting returns of at least 6%.
- 5 of the 14 are expecting returns of at least 9% for 2022. Looking at their accuracy, 4 of these analysts’ forecasts were within +/- 3% of where the S&P 500 finished in December 2021. Deutsche Bank was the outlier and NSAG does not have conviction in their equity forecasts.
NSAG’s Macro Outlook
 For 2022, we remain bullish on equities over bonds. Our key reasonings include strong forecasted economic growth, forecasted earnings growth, and rate hikes. Let’s start with rate hikes. The U.S. Federal Reserve has announced a plan for three rate hikes in 2022, and three more in 2023. Generally, we observe that elevated rates tend to compress asset prices (both equity and bond prices). Cash flows from either equities or bonds are discounted at a greater magnitude as rates rise.
Although, there is a caveat to contractionary Fed policies. Typically, the Fed will only implement contractionary policies (raising rates, decreased asset buying) when they feel that the economy is strong enough to forego their support. Forecasts for economic growth and earnings growth in 2022 are strong, and we will likely see equities reap the most benefits from this potential growth. During the previous four rate hike cycles, we saw the S&P 500 produce an average total return of ~37% over the following three-year period (Raising your Investor IQ, slide 44). This concept is especially prevalent given the circumstances caused by the pandemic. Since March 2020, we saw the Fed act in a historically expansionary manner. When the pandemic emerged, most did not expect the amazingly quick economic recovery we’ve experienced. This has amplified the supply chain bottlenecks as companies improperly planned inventory levels, hiring, and production. In Q4 of 2021, many executives within various sectors are reporting that they are beginning to see these issues subside.

A strong economy can also benefit the bond market due to improved fundamentals. Ultimately, we believe equities will reap the majority of benefits that 2022 has to offer.
U.S. vs. International & Emerging

U.S. equity has outperformed international and emerging equity over the last 11 years. In recent memory, U.S. equity markets have continued this trend in 2020 and 2021, outperforming developed international and also emerging market equity. In 2022, there are many macro-level variables that will factor into U.S. and International performance. These factors include economic growth, valuation, interest rates, Central Bank policies, US Dollar levels and inflation.
Annual Real GDP in the U.S. is expected to grow at strong rate of 4% and 2.4% in 2022 and 2023, respectively (FactSet Economic Estimates, 2021). Looking at multiple countries across the globe, from developed European countries to China and India, real GDP growth is forecasted to keep pace or even exceed U.S. growth in 2022 and 2023 (Raising your Investor IQ, slide 7). From a valuation standpoint, developed international equities are currently trading at a ~33% P/E (Price to earnings) discount to U.S. equities. From an algebraic perspective, as Central Banks adapt more contractionary policies, which includes rising interest rates and decreased asset buying, valuation levels inherently compress. Higher than average valuation levels are more likely to be affected by these policies. The U.S. Federal Reserve implemented contractionary policies in Q4 of 2021. While we’ve seen U.S. equities (S&P 500) perform well on average throughout historic rate hike cycles by the Federal Reserve (Raising your Investor IQ, slide 42), elevated valuation levels do pose an inherent risk. Currency values also have an impact on performance. Currently, the U.S. is forecasted to have a higher annual inflation rate in 2022 than the other six G7 countries (~4% CPI) (FactSet Economic Estimates, 2021). While we’ve seen some relative strength in the dollar over recent months, a higher CPI print, relative to foreign countries, could put pressure on the dollar’s value. Historically, the dollar’s value and U.S. equities are positively correlated. Lastly, developed international equity historically offer higher dividend yields (Raising your Investor IQ, slide 50).
Technological advancements in the U.S. have outpaced the rest of the world over the last decade, and it is likely that other countries will continue striving to compete at a higher level. This trend could benefit U.S. equity, international and emerging equity. For the U.S., it pays to be the leader of the pack, and U.S. firms will likely benefit from continued growth around the world. Given these various factors, we remain in favor of a healthy balance between U.S. and International equity in 2022.
Large Cap vs. Mid & Small Cap

In 2022, we recommend a healthy balance between mega/large cap equity and mid/small equity. One of the biggest key catalysts in the performance of small cap equity is economic growth. As we mentioned earlier in “U.S. vs International” debate, annual Real GDP in the U.S. is expected to grow at strong rate of 4% and 2.4% in 2022 and 2023, respectively (FactSet Estimates, 2021). Stronger than normal economic growth allows smaller companies to gain market share against competitors. For large cap firms, they are typically the leaders within their respective space, and occupy “mindshare” within consumer’s heads. “Mindshare” refers to the first name you think of when given a product type. A few examples include; phones = Apple, streaming = Netflix, shopping = Amazon, etc. This is a powerful concept as large cap firms have continued post strong fundamental performance.
From 2006 to 2021, small cap equity has outperformed large cap equity 8/16 calendar years (Raising your Investor IQ, slide 22). Small cap equity is historically more volatile due to its inherently larger business risk, which includes operational risk and financial risk. Additionally, Large Cap and small cap equity have a historic correlation of around ~88%, so there are some diversification benefits. (FactSet SPAR 3.0 – S&P 500 vs. Russell 2000, 20-Year Correlation). Due to these various factors, we remain in favor both large cap and small cap equity in 2022.
Value vs. Growth:
Before beginning our discussion on value vs. growth equity, we’d like to start by examining why a stock would be classified as either “value” or “growth.” Below, we outline the quantitative characteristics of each:
Value characteristics:
- Very steady and predictable cash flows with low variability, lower competition levels
- Reasonable to low valuation levels (P/E, P/S, P/B)
- Lower to Middle single digit % growth in revenue and earnings
Value equity exhibit these characteristics because their future earnings and cash flows are highly predictable and they have already generated large shareholder equity value on the balance sheet. This leaves investors with less speculation on what each respective firm should actually be worth.
Growth characteristics:
Growth equity exhibit these characteristics for the opposite reason of value equity. A “growth” company is more speculative, whose earnings and cash flows are expected to come later in the future, not in the near term. Due to this, these firms have likely not yet generated substantial shareholder equity value on the balance sheet. This leads to high valuation levels, given the gap between price and current fundamentals, with investor expecting this gap to be filled by cash flows/earnings over the long-term.

Reverting back to 2022, growth equity is likely to face stronger headwinds than value. This is due to current Federal Reserve actions, and rising rates. As the Fed becomes more contractionary, and rate hikes rise, higher valuation/speculation stocks are more susceptible to greater impact. Growth equity is historically more sensitive to interest rate movements than value equity. As rates rise, growth equity P/E is more harshly compressed in comparison to value equity (Raising your Investor IQ, slide 43). While we don’t want to walk away from growth equity, we slightly favor value in 2022 as we will likely see a rotation out of growth equity in the near term due to the macroeconomic factors discussed above.
Active vs. Passive

Active vs. passive investing is a topic discussed and questioned by many of our clients and other investors. One of the primary concerns between the two investment strategies are costs. Typically, an actively managed fund will have a higher-than-average expense ratio due to a higher management fee. So, the question asked is, “Are actively managed investments worth the additional cost?” On a net basis, the majority of NSAG’s fund lineup has outperformed their respective benchmarks overtime. Our data analysis shows that over the long-term, active management will outperform the index benchmark ~60% of the time when randomly picking an active fund. This analysis is done by randomly sampling large-cap active funds from a universe of large-cap funds and comparing that sample’s average outperformance versus the universe. Each universe monitored contains 500 of the top actively managed funds in each category from large-cap value, small-cap, mid-cap, international, various fixed income categories, etc. Additionally, from NSAG’s perspective, we monitor each universe and continuously assess to see where our most used active funds rank in terms of performance and risk-adjusted performance. Generally, we look within these universes for investments ranking in the top 2 quartiles against their peers.
Additionally, overall valuation levels are elevated compared to historical levels in equities. These levels are further elevated by large outliers from a valuation standpoint. In passive investing, investors generally won’t be able to avoid some of these more speculative investments. Active management, on the other hand, allows investors to side-step some of these potential risks. By sustaining an annual outperformance, even if it is slight, outsized total returns can be achieved over the long run. We continue to be more bullish on active management in 2022, as we have found that the slight increase in associated costs have paid off.
Equity Allocation in a rising rate environment
“History doesn’t repeat, but it often rhymes.” As discussed above, the Federal reserve is planning a rate hike cycle over the next two years. So, we developed a new modeling tool that utilizes prescriptive analytics to help us further optimize portfolio allocations for the approaching climate. Our model analysis helped to emphasize that the best investment strategy over the past 10 years will likely not be the best investment strategy when rates are rising (and vice versa). Therefore, using historical data from the past 4 rate hike cycles, we were able to find the optimal allocation in an attempt to maximize returns on a risk-adjusted basis, while still remaining invested in all major asset categories.
While not every portfolio has to exactly match what the model tells us, the modeling tool helps to shed a light on portfolios that might be out of balance, taking too much risk or underprepared for a rate hike cycle.
New Year’s resolutions
Magically every January households create lists goals for the new year. While the themes are similar from year-to-year, it is the consistency of daily choices that gets in the way of creating and keeping new habits. Creating achievable goals or mini goals is also important. A few of the top resolutions for 2022 include:
- Exercising more
- Saving money
- Paying off debt
- Losing weight
- Spending more time with family
- Travel
- Reduce stress
NSAG Revelation
Will these predictions be right? In some ways.
Will they be wrong? Almost certainly.
While it is probably not the right approach, predictions are usually judged by how to right or wrong they turn out to be.
NSAG finds that there is an innate value in the exercise of looking at the current state of things and thinking about where the winds will take us.
Beyond the success or failure of prognostications, we find extreme value in constantly refining our process by revisiting predictions to see what was missed.
Where will the equity markets go next?
Consumer holiday spending (Nov. 1 through Dec 24) was up between 8-9% in 2021 as compared to 2020 & 2019. This spending also excludes many purchases that took place prior to November as consumers moved up purchases due to inventory concerns.
The US consumer remains strong yet struggles to complete many of the purchases they desire. This strength should limit any potential pullbacks into focused areas of speculation and those impacted the most by rising interest rates. The continued rotation from growth to value is likely to continue for at least the next year and should pick up steam as interest rates rise in connection with either COVID variants slowing down, rising inflation or both.
There continues to be virtually zero risk of a double-dip recession and the Federal Reserve is prepared to speed up or slow down when necessary. We still believe we are in a secular bull market, which started in 2010 and typically lasts around 15-20 years. However, this secular market is likely to last longer due to a slow start in 2010-2013.
We are passionately devoted to our clients' families and portfolios. Let us know if you know somebody who would benefit from discovering the North Star difference, or if you just need a few minutes to talk. As a small business, our staff appreciates your continued trust and support.
Please continue to send in your questions and see if yours gets featured in next month’s Timely Topics.
Cheers to 2021 and start of 2022!
Best regards,


Mark Kangas, CFP®
CEO, Investment Advisor Representative