


Each month we ask clients to spend a few minutes reading through our newsletter with the goal of raising their investor IQ. This month we serve up a few main dishes and treat you to dessert as we slide through Thanksgiving.
- A metaverse Thanksgiving?
- Medicare premiums skyrocket
- Is inflation transitory or persistent?
- Don’t fear the rate hike
- NSAG News
- Where will the equity markets go next?
A metaverse Thanksgiving?
After 18 months of virtual meetings and holidays, it appears we may be headed towards a metaverse Thanksgiving. So, what is the metaverse? It is a world where humans put on a headset or smart glasses that allow them to live, work and play in a virtual world. I recently watched the movie “Ready Player One” which depicts one example of this virtual world.
The first companies to create a new product or environment tend to control the information and profits. Therefore, companies are scrambling to build the infrastructure, protocols and pick the currency flows for the future metaverse.
In the metaverse, people create avatars to represent themselves as they go about attending work meetings, exercise, vacation, concerts, shop, play games with friends, buy cars or even attend Thanksgiving virtually. While the virtual experience can save a lot of time and even the headaches associated with mundane activities like buying a car, it is presented with simple hurdles of enjoying a meal and getting users to wear a device to participate in the experience. 3D TVs have been around for a long time and never caught on due to the glasses requirement. It is still too early to determine where the metaverse will end up. Considering companies are already starting to pour billions of dollars into research and development, it is likely that some version of the metaverse will be on our doorstep soon. The metaverse alone could become a multitrillion-dollar industry, a larger financial ecosystem than many countries. In the meantime, I look forward to tasting my Thanksgiving in reality and physically traveling to my next vacation.
Medicare premiums skyrocket
The federal government announced a 14.5% increase in Part B premiums for 2022. This increase will take monthly payments for those in the lowest income bracket from $148.50 a month this year to $170.10 in 2022. Thankfully, this increase will be offset by the Largest Social Security raise in 40 years that we shared last month. A retired worker who currently receives $1,565 per month from Social Security can expect to receive a net increase of $70.40 more per month after the Medicare Part B premium is deducted in 2022. The net result is still +4% increase in Social Security / Medicare benefits.
Is inflation transitory or persistent?
Yes. The longer we experience higher prices, the longer they will stay. NSAG still expects the prices for many goods and raw materials that are stuck on boats, trains, trucks and planes to eventually decline as the supply disruption is alleviated over the next few quarters. Many companies have been able to push through short-term pricing adjustments to protect their bottomline profits. Brian Wesbury, Chief Economist at First Trust doesn’t see the Fed’s 2% inflation target returning anytime soon. He is expecting inflation to cool off and run closer to 4% in 2022. Wesbury provided two simple examples of why inflation should start to moderate:
- Oil ended 2020 at $48 per barrel and recently closed at $81. While oil prices could move up again in 2022, they will not likely increase another 70% like they have so far this year.
- Consider the massive supply-chain issues, particularly with computer chips, that have disrupted the automobile market. Prices for new cars and trucks are up 9.8% from a year ago; prices for used cars and trucks are up 26.4%. Higher semiconductor production should curb price increases next year and prices might even fall modestly in this sector.
Labor prices on the other hand are likely to be persistent. Regardless of the many reasons why labor prices have gone up, we are unlikely to see most labor rates fall. Companies are already preparing to deploy technologies to replace labor and bring down their costs.
With year-over-year (y/y) headline inflation (CPI) coming in at 6.2% this month, it has now been six straight months where the headline reading has been at or above 5%. With that streak, the current period now joins just a small set of other periods where year-over-year CPI has been at or above 5% for a half year or more. There have only been six other periods to reach this milestone with the most recent occurring in 1991. Of the remaining five periods, three spanned the period from 1970 through 1982, while the other two were in the decade following WWII. The duration of these streaks varies widely. The longest of these, ending in 1982, lasted 70 months, or nearly six years! The next longest streak was more than three and a half years (1976), two others were two years or more (1948 and 1971), and two were less than two years. Investors want to know what this now 'persistently transitory' inflation means for equity market returns.
To help answer this question, we looked at how the S&P 500 performed following the sixth month of each prior streak where y/y CPI was at or above 5%. Looking at forward returns following each of these periods, the results are mixed to say the least. Diving into the details a little more, the one thing the two periods of positive returns have in common is that the elevated inflation readings did in fact end up being transitory. The streak in the early 1950s ended up lasting just over a year (13 months) while the streak in the early 1990s ended at seven months. At six months, the current streak still ranks at the short end of the spectrum relative to prior streaks, so bulls don't need to panic yet. But the longer we see these elevated readings, the more of a headwind it will likely become for equities.
Don’t fear the rate hike
Probably the most common question we have been asked lately is “should I liquidate my entire portfolio before the Fed starts raising rates?” NSAG’s answer is no, and we expect the economy to surprise many as it performs well over the next few years. While every period is different, we can analyze past four rate hike periods (1994, 1999, 2004 and 2015) to better understand where we are today.
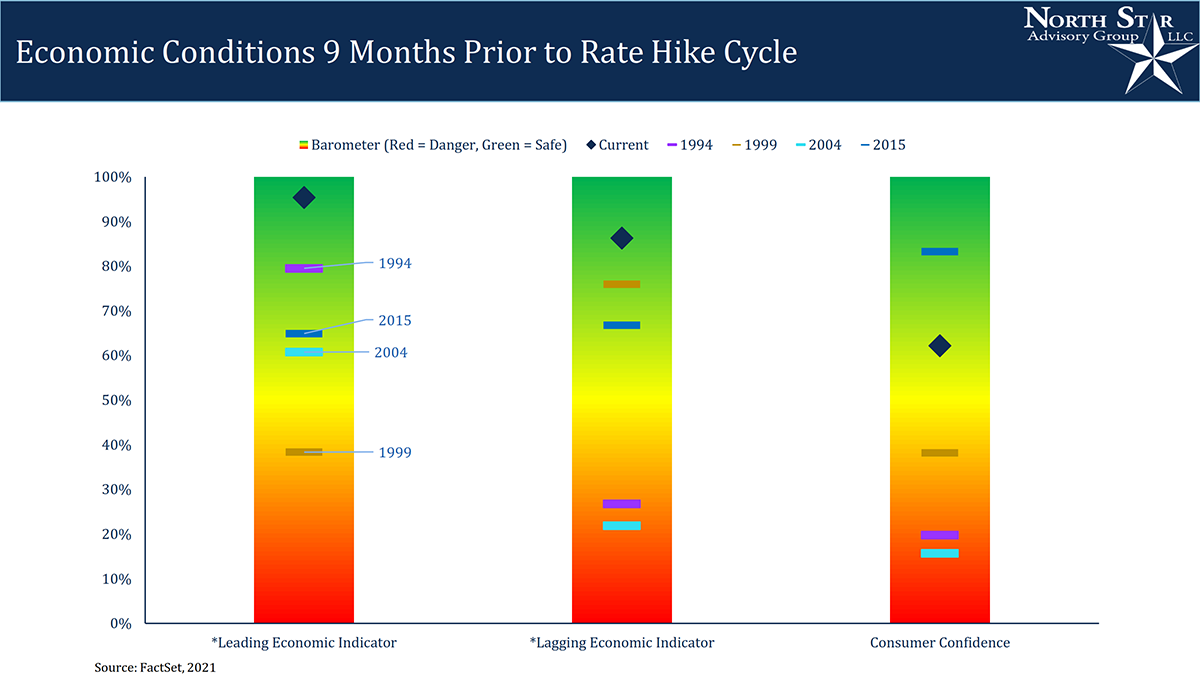
First, let’s look at the economic conditions nine months prior to a rate hike cycle. The Fed is expected to start raising rates mid to late summer of 2022. The following barometers show that the current leading and lagging indicators are stronger than all 4 prior periods being evaluated. While consumer confidence is trailing 2015’s reading, we are well aware of the supply disruption impacting 2021’s reading.
Second, we can look at the equity returns before and after the rate hike cycles. At first glance, the S&P 500 has gained on average 10.83% in the 12 months prior to the initial hike and continue to climb another 26% for the 36 months after the initial hike. NSAG dove a bit further to analyze each individual year. Interestingly, we found that 1999 was the only period that ended up lower 36 months later and had a dramatic impact on the average. So, what was different about 1999?
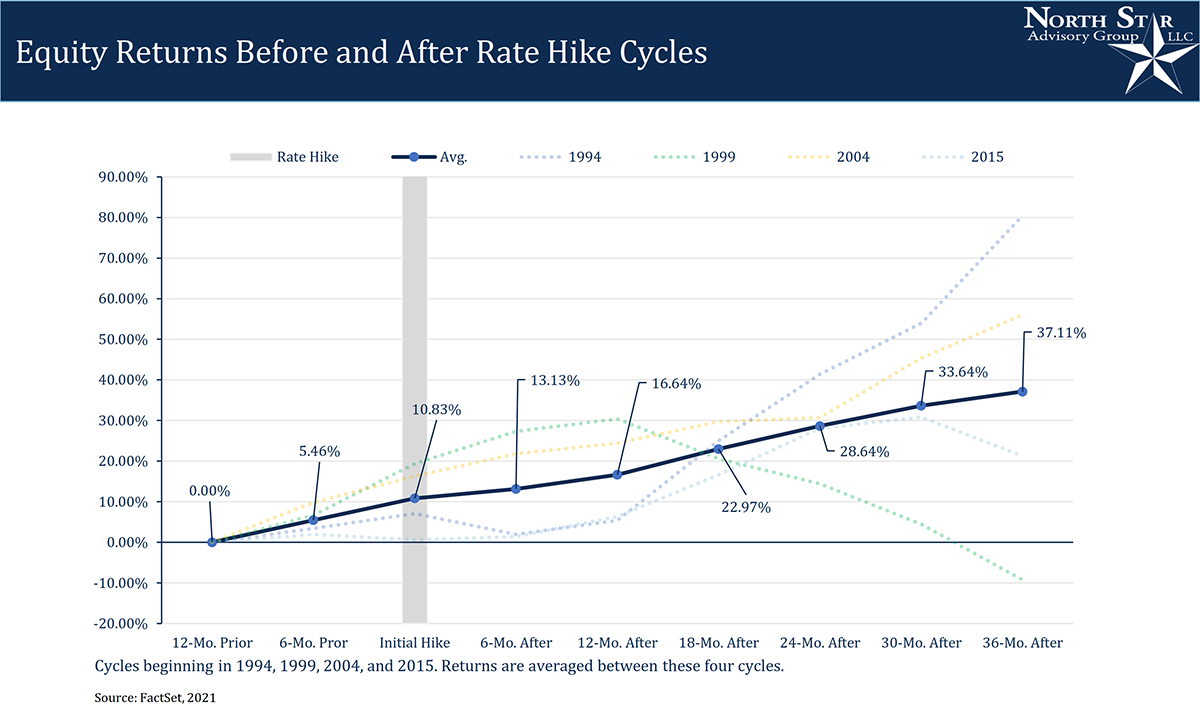
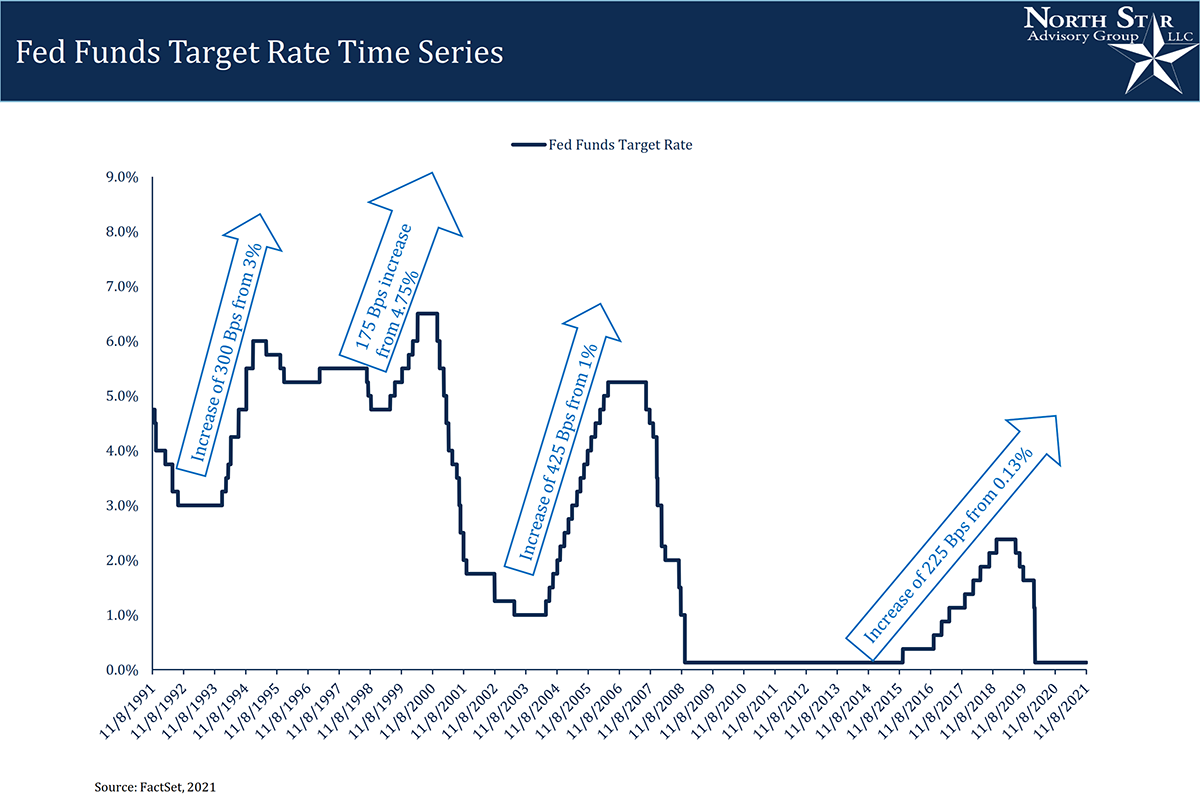
In 1999, the Fed started raising rates from 4.75% and stopped once they reached 6.5%. The rate hikes for the other three periods started at lower levels and particularly, the starting levels of 2004 & 2015 are likely more representative of the environment for the potential 2022 hikes.
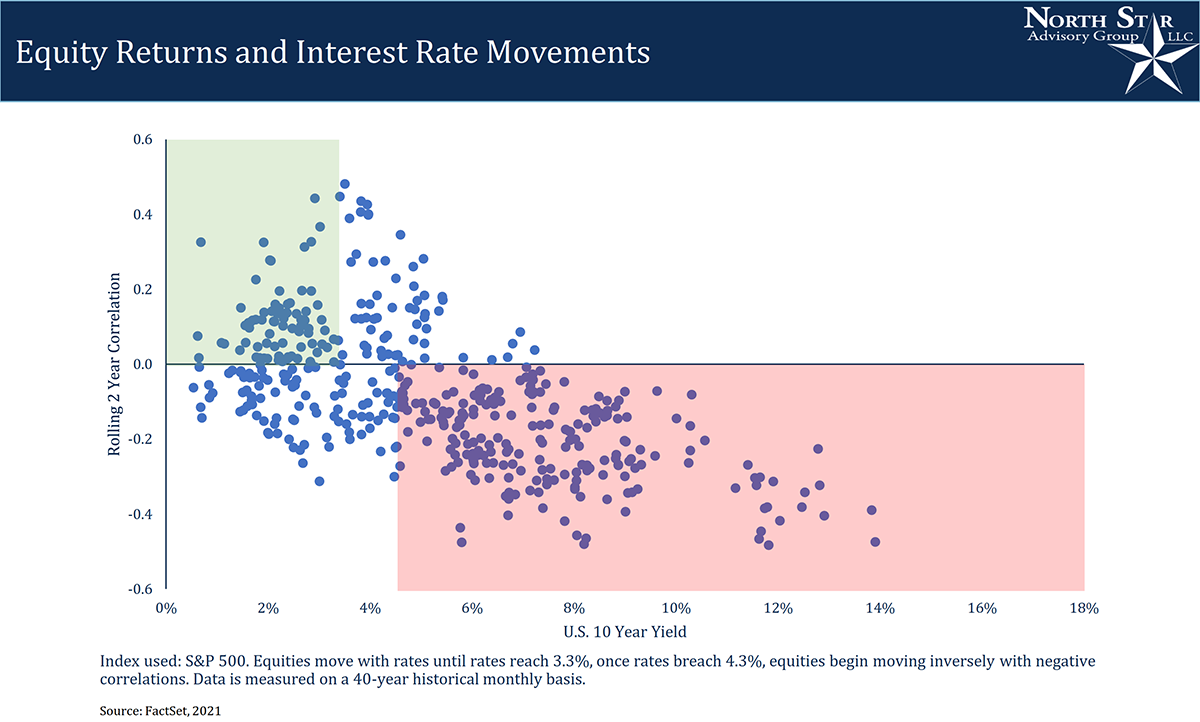
Finally, we bring back a chart that we produced a few months ago. When plotting the correlation of rising rates to rising interest rates versus the 10-year US Treasury, we do see two identifiable patterns. When interest rates are less than 4%, rising interest rates tend to lead to higher equity prices as shown in the shaded green area. Inversely, raising rates when from levels above 4% tend to lead to lower equity prices as shown in the shaded red area.
It is for these reasons that not all rate hikes are created equal. Rising rates from extremely low levels during strong economic environments can be absorbed by companies with pricing power and strong balance sheets.
NSAG News
While our meeting schedule has remained full, we have seen a temporary increase in requests for virtual meetings as we approach the holidays. Families are communicating that they are limiting their potential Covid exposures to protect their ability to see their loved ones over the coming weeks. This virtual shift is likely partially to blame on the lower consumer confidence numbers along with the general lack of supply of goods. This strong desire to be in person with family may indicate a future desire to return to work as well as limit the potential of future metaverse holidays.
Where will the equity markets go next?
The US consumer remains strong, yet struggles to complete many of the purchases they desire. This strength should limit any potential pullbacks into focused areas of speculation and rising interest rates. The continued rotation from growth to value is likely to continue for at least the next year and should pick up steam as interest rates rise in connection with the Delta variant slowing down.
There continues to be virtually zero risk of a double-dip recession and the Federal Reserve is prepared to step in or slow down if necessary. We still believe we are in a secular bull market, which started in 2010 and typically lasts around 15-20 years. However, this secular market is likely to last longer due to a slow start in 2010-2013.
We are passionately devoted to our clients' families and portfolios. Let us know if you know somebody who would benefit from discovering the North Star difference, or if you just need a few minutes to talk. As a small business, our staff appreciates your continued trust and support.
Please continue to send in your questions and see if yours gets featured in next month’s Timely Topics.
Best regards,


Mark Kangas, CFP®
CEO, Investment Advisor Representative