


Each month we ask clients to spend a few minutes reading through our newsletter with the goal of raising their investor IQ. As we enter June, we focus our Timely Topics commentary on savings options, followed by a review of personal and government debt.
- I-Bond rate slashed
- Debt ceiling
- Consumer finances
- Top Hat Plans
- NSAG News
- Where will the equity markets go next?
I-Bond rate slashed - The end of I-Bonds?
The rush to purchase I-Bonds may be over after the US Treasury dramatically reduced the payment rate for I-Bonds in May 2023. If we were looking for an indication of where inflation is headed, this might be a good guide. As you can see from the following table, newly purchased I-Bonds will yield 4.3% for the next 6 months, while most bonds purchased from 05/2020-10/2022 will only yield 3.38%!
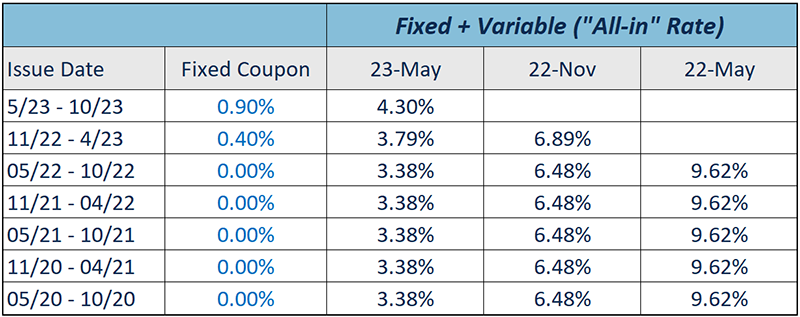
Clients are asking if falling I-Bond rates are a good predictor of future inflation rates. The simple answer is yes. These variable rates can be an accurate predictor of future inflation.
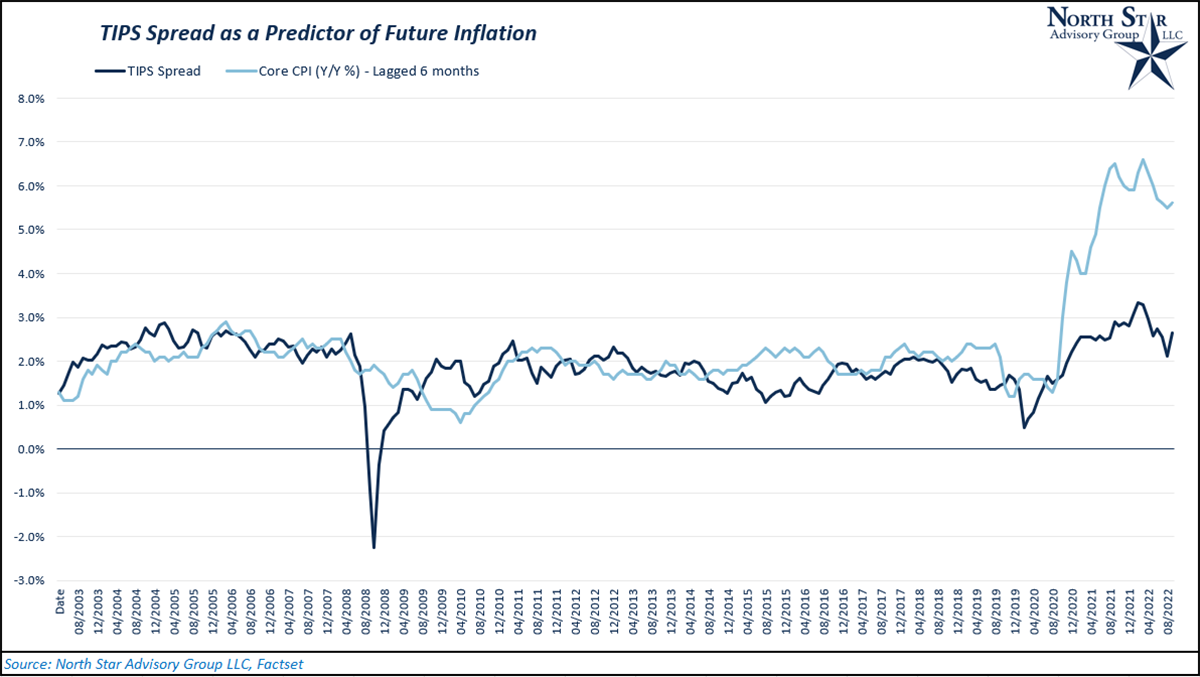
Fixed rate bonds that do not account for changes in inflation have an embedded “inflation premium” within the fixed rate. By isolating the inflation component of fixed rates, we can compare that component to actual inflation trends. The inflation component of fixed rates can be measured via the “TIPS Spread” (Discussed in further detail in the next paragraph). When analyzing these two data series, we observe a positive relationship. As the TIPS spread increases, we generally see an upward move for inflation and vice-a-versa.
For those who would like to dive a bit deeper into the numbers, we ran two separate linear regressions to analyze this question. Both regressions use the Treasury Inflation Protected Securities (TIPS) spread as a predictor of inflation measured by core CPI. Core CPI excludes food and energy, which tend to be more volatile components of the overall CPI index. While treasury bonds have a fixed rate, there are multiple components built into that rate level. This fixed rate is known as the nominal rate.
Nominal rate = real risk-free rate + inflation expectations + premium for uncertainty of inflation expectations
Once the fixed rate is set for a newly issued fixed rate treasury, the price of that bond will fluctuate daily as market expectations change. I-Bonds have variable interest payments that are reset semiannually to account for future inflation expectations. Lastly, TIPS offer the same benefits as I-Bonds (inflation protection), although, the principal or “face value” of the bond is adjusted for inflation, while I-Bonds have variable interest payments that are tied to inflation.
So, since the inflation component is not embedded into TIPS interest rates, we can subtract the interest rate of TIPS from fixed rate treasuries. Doing so isolates the inflation component of the nominal rate and compares that component versus actual CPI inflation.
- Regression 1
- 20 years of monthly TIPS spread data is regressed against core CPI inflation in that same month.
- The relationship is statistically significant.
- Correlation = 43%, R-Square = 19%
- Beta = 0.81
The beta and correlation data tell us that there is a positive directional relationship between the two data sets. As the TIPS spread decreases, inflation during that same month is likely to decrease as well. Although the relationship here is significant, the R-Square value (19%) tells us that the relationship is not very strong.
- Regression 2
- 20 years of monthly TIPS spread data is regressed against core CPI inflation 6 months in the future.
- The relationship is more statistically significant.
- Correlation = 49%, R-Square = 24%
- Beta = 0.91
The beta and correlation data tell us that there is again a positive directional relationship between the two data sets. As the TIPS spread decreases, future inflation (6 months from now) is likely to be lower. Based on R-Square, the relationship strengthens relative to our first regression.
For clients who own I-Bonds, the timing of the interest rate changes depends on when the bond was issued. Although new rates are announced each year in May and November, the date when the rate changes for your bond will be every 6 months from the issue date of your bond. Therefore, the timing of your sale of I-Bonds purchased in months other than May and November can be a bit more complicated. We encourage clients to reach out to NSAG for guidance on designing potential exit strategies.
Debt ceiling
A major topic of discussion over the past few months has revolved around the U.S. debt ceiling. On 01/19/2023, the U.S. hit its current debt ceiling of $31.4 Trillion. The debt ceiling represents the cumulative amount of money the U.S. can borrow through the issuance of treasury bonds. Given that the U.S. has historically ran at a budget deficit (government spending is greater than government revenues), the debt ceiling is critical. If the debt ceiling is not increased, the U.S. will have to default on its debt. This month, we break down a few points to understand regarding the debt ceiling debate and the potential outcomes of a default.
Mark Zandi, chief economist at Moody’s Analytics provided the following potential outcomes if the debt ceiling was breached:
- Potential job losses for:
- 1.5 million jobs if the breach is less than a week.
- 7.8 million jobs for a longer breach.
- Stock market losses of $10 trillion.
- Risk decreasing the stability of the U.S. dollar as the major currency for international trade and foreign exchange reserves held by world central banks.
- Diminish the financial power of the U.S.
Of course, these outcomes might not come to fruition. NSAG is also concerned about the potential immediate increase in interest rates caused by a downgrade of U.S. debt. This raise would have an immediate ripple effect across the globe, with higher rates for Home Equity Lines of Credits, mortgages, corporate lending, auto loans, municipal bonds and even the U.S. Governments own borrowing rates. The damage alone could be so severe, it appears to outweigh the costs of raising the debt ceiling.
This limit has been raised 17 times over the past 20 years and 78 times since 1960. Two leading factors are contributing to the heated debate now are:
- COVID-19 pandemic’s impact is being felt once again. U.S. spending and debt issuance skyrocketed in 2020 and 2021 due to pandemic relief programs, easy monetary policy, and easy fiscal policy. Representatives in Washington have become concerned over the country’s budget and spending policies.
- Politicians in Washington, DC may be more divided than ever. The growing number of far-left Democrats and far-right Republicans makes it harder for the two sides negotiate a middle ground. Even Kevin McCarthy, the Republican Speaker of the United States House of Representatives only holds a slim control of his position, which reduces his ability to ignore negotiating demands from minority members of either party.
To judge current fiscal responsibility, we examined the budget deficit and debt to GDP ratio. Over the past 4 quarters, the fiscal deficit (as a % of GDP) has deepened to -6.9%. In 2022, that number was -5.5%, so we’ve seen this metric worsen significantly in just the first quarter of 2023. According to the CFA Institute, a reading of -4% or worse should be a cause for increased credit risk concern. Additionally, the debt to GDP ratio has risen to 119% as of 3/31/2023. This number is also well above the CFA’s cause for concern range. Even with all these concerns factored in, the U.S. is still the largest and strongest economy globally, which can provide somewhat of a safety cushion to encourage continued lending to the U.S.
Given these metrics, we believe it is fair to have concern over the direction of fiscal policy, while also recognizing the fact that a default would likely cause a period of severe financial stress in the U.S. and across the globe. The U.S. has previously defaulted in 1790, 1861, 1933 and 1979. Ironically, 1979’s default was partially caused by the postponement of several securities auctions because of Congressional debate over the national debt ceiling. In 2013, the U.S. temporarily suspended the debt ceiling during negotiations and even went into a partial shutdown on October 1, 2013, with about 800,000 Federal employees being put on temporary leave. Joe Biden’s experience of serving as the 47th vice president during this shut down may provide some with hope that the U.S. can avoid a 2013 repeat. Unfortunately, many politicians in Washington DC were not in office in 2013 and therefore do not have the same firsthand experience of the impact that a delayed negotiation can cause.
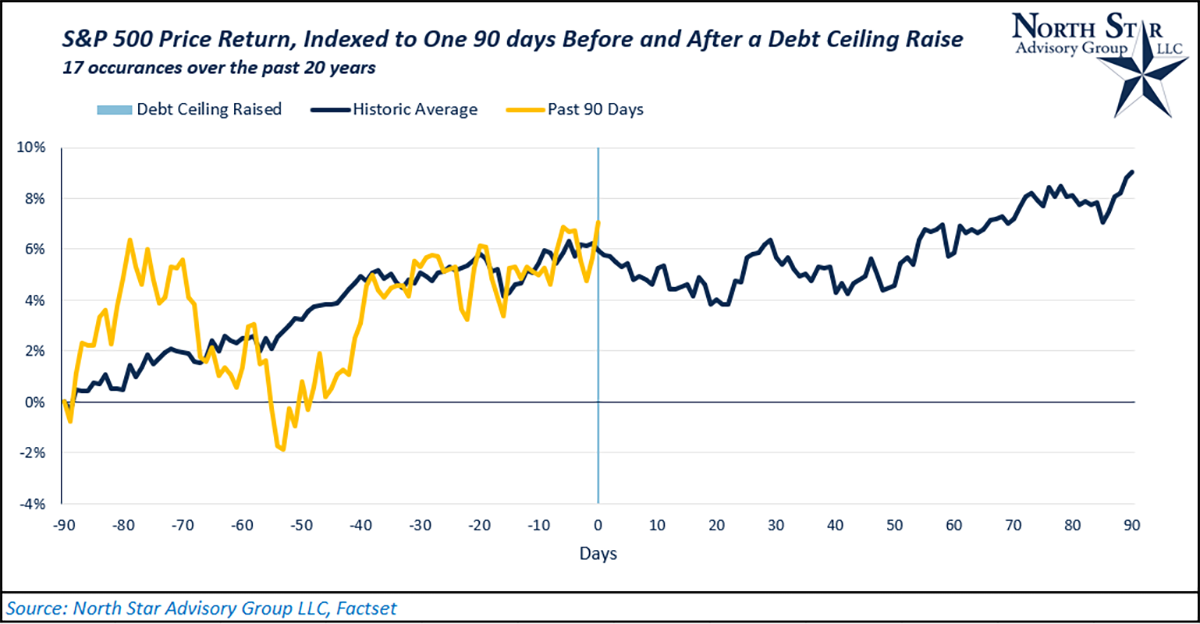
What does that debt ceiling mean for the capital markets? Historically, equity markets have powered through debt ceiling negotiations on the upside. Over the past 20-year period, we analyzed the equity returns 90 days prior and 90 days after each of the 17 debt ceiling increases. As you can see in the chart below, on average, the markets have increased through this 180-day period with little movement during the 40 days pre- and post-increase. In yellow, we overlay the past 90 days prior to the tentative debt ceiling agreement on May 28. It is important to note the earlier drop during the current yellow 90 day period was caused by regional bank failures.
Consumer finances
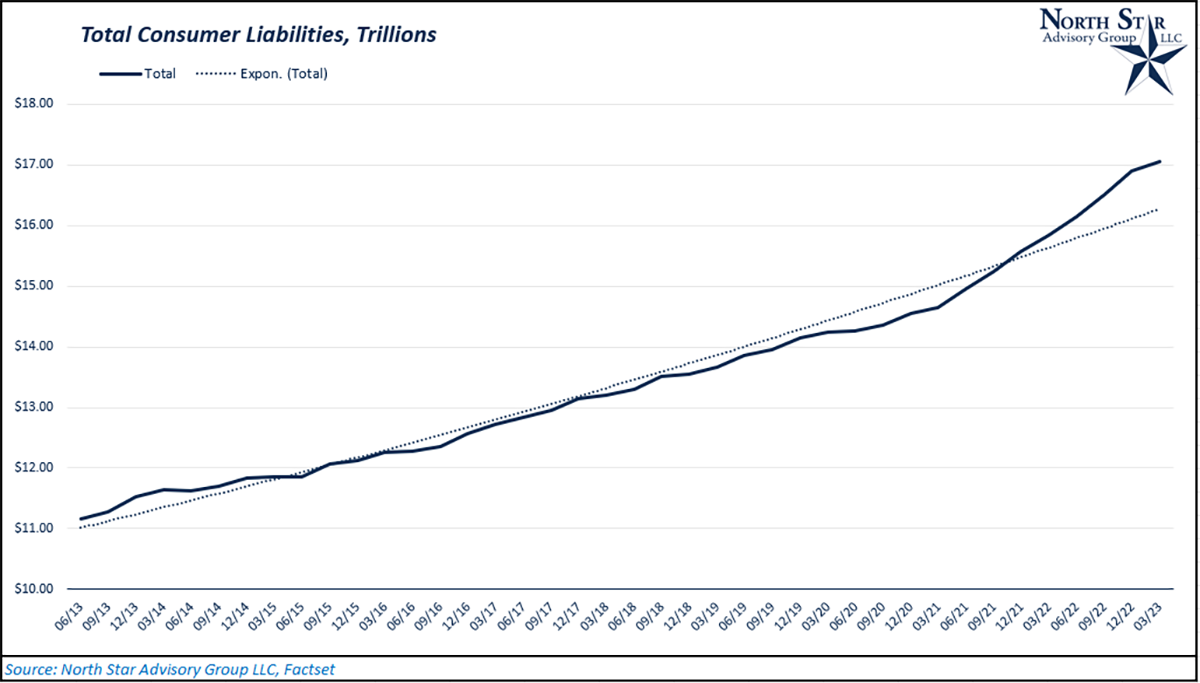
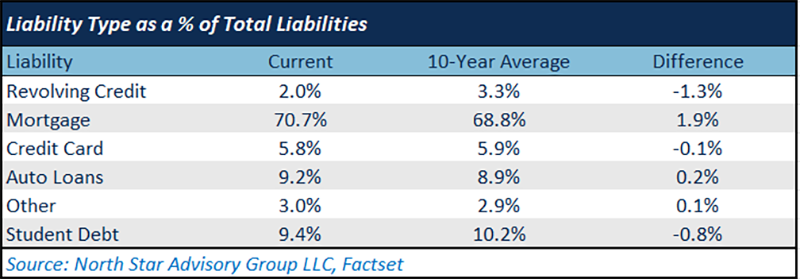
As the markets continue to be hyper focused on corporate earnings and monetary policy, the state of the consumer will continue to be a key factor driving both the former and the latter. For the first time ever, total U.S. household liabilities exceeded the $17 Trillion. With that being said, we ask the question, are households too overleveraged and what kind of liabilities are they holding?
Over the past 2 years, total liabilities have increased from $14.6 Trillion to $17.05 Trillion, representing a 16.4% increase from 3/31/2021 to 3/31/2023. As COVID vaccines rolled out and the economy began re-opening, consumers had an itch to travel and adventure. In 2021, there was a spending shift from services towards goods and travel. While supply chains remained disrupted due to differing COVID policies globally, strong demand also contributed to and compounded that disruption. Consumers focused their spending on traveling, eating out, buying new cars, and buying new homes at elevated prices.
Interest rates rose quickly in 2022 and significantly slowed the mortgage and auto industry. Consumers continued to focus their spending on other goods, which contributed to a large increase in total liabilities for U.S. households. As you can see from the chart below, total liabilities have risen considerably above their 10-year trend line. Although, if you look at the “Liability Type as a % of Total Liabilities” table, you’ll see that the mix is not significantly off its long-term averages. The largest difference is in mortgages, although they generally take the lion’s share of total liabilities.
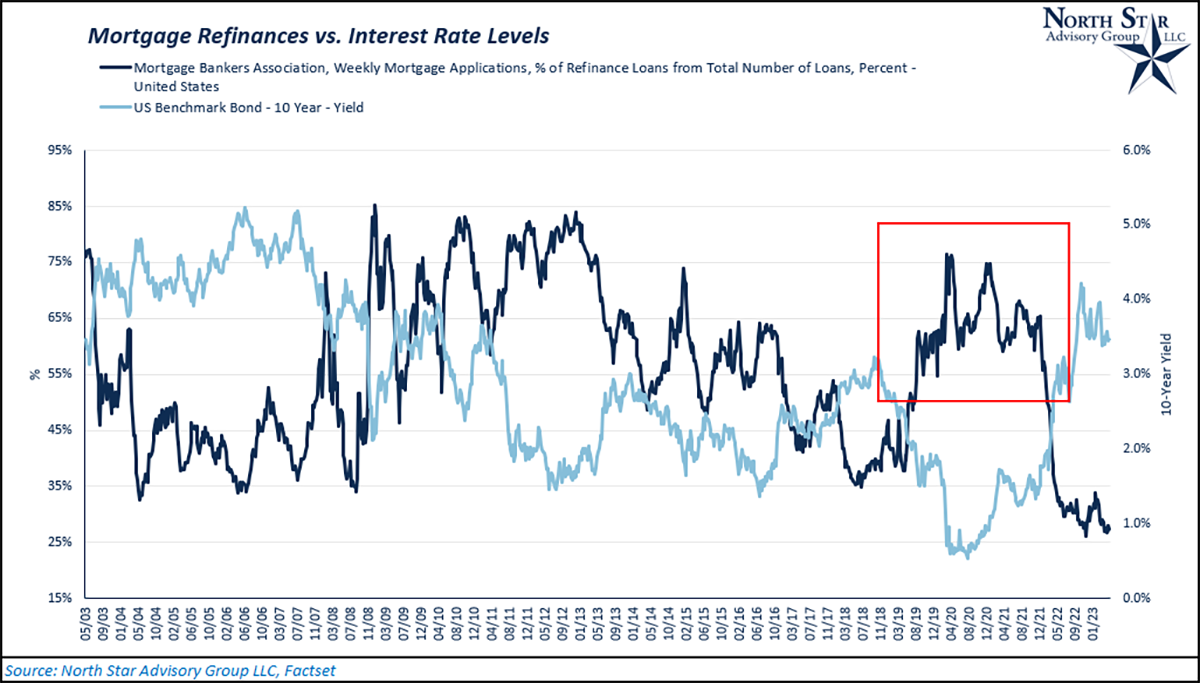
The U.S. Federal Reserve significantly reduced interest rates in 2020 to stimulate the economy and counterbalance the impact of COVID shutdowns. The Fed’s move dropped the 30-year mortgage rate below 3% and sparked a massive boom in mortgage originations and refinancing to lock in lower rates. So, while the increase in the volume of mortgage drove the total liabilities, the new mortgage rates may not have actually increased the total cost of debt servicing to borrowers.
Going forward, borrowers with low mortgage rates will now be less likely to move, because any move would cause them to give up their low mortgage and replace it with a new one, which could have an interest rate 2-3 times higher. NSAG expects these homeowners to stay longer in their homes which will further reduce the future availability of homes for sale.

Top Hat plans
The Wall Street Journal recently published an article titled, “For Executives Only, CEOs Amass Billions in Savings With ‘Top Hat’ Plans” and reported that the top five executives at 500 large publicly traded companies held a combined $8.9 billion in Top Hat Plans. This article sparked curiosity from several clients as they inquired about the potential benefit if Top Hat Plans and if they should set one up for their small business. While these plans work well for publicly traded companies, we generally do not recommend small business owners use them for their own benefit.
There are two general types of Top Hat Plans:
- A nonqualified deferred compensation plan that permits participants to defer an amount of income into the plan during each calendar year. Contributions often go into a Rabbi trust.
- A supplemental executive retirement plan (SERP). SERPs provide additional retirement income to the plan participants in excess of what they are entitled to receive under the employer's qualified plan. In a SERP, the employer provides the funding for the annual contributions to the plans and there are usually limits based on factors such as annual salary that determine the exact amount of funding provided.
Positive #1: The plan is allowed to define and select a group of employees the plan covers. So, who can be included?
- The DOL explained its understanding of the “select group” requirement in its 1990 Advisory Opinion, arguing that this term refers to those employees who, “by virtue of their position or compensation level,” have the ability to negotiate the terms of their deferred compensation arrangement, and thus do not need the substantive rights and protections afforded by ERISA.
- Courts tend to look at the percentage of an employer’s total work force who participate in a plan. Coverage of between one and five percent of an employer’s work force has been held to satisfy the select group requirement, while a plan covering 20 percent was held to fall outside that requirement.
Positive #2: Based on the plan design, distributions may be paid out as one of the following:
- Single-sum cash payment
- Series of installments
- Single-sum cash payment plus a series of installments
- In-kind transfer (which will be taxed as a single sum cash payment)
Unless stated in the plan document, there is no limit on the number of installment payments you can receive.
If no payment election is made, the account will be paid as a lump sum within 60 days of termination of employment or the default distribution timing stated in your plan document. Because the accounts are the property of the plan until paid, the plan must request any distributions.
Negative #1: To qualify as a Top Hat Plan, it must be considered unfunded, which means:
- The assets of a Top Hat plan must be available to the employer's creditors at all times.
- The participant merely has an unsecured promise by the employer to pay the amounts under the plan when due (retirement or separation from the company).
Generally speaking, the legal council of the employees will advise against taking this type of compensation arrangement due to the potential risk of loss and lack of control.
Negative #2: Taxation
- The plan assets are not rollable into a qualified retirement plan or IRA. Therefore, upon final distribution principal contributions and growth are all taxed as ordinary income. For high earners, this does not save them on taxes, it just delays paying the tax bill.
- In fact, due to the size of the final taxable distribution, the ordinary income tax rate is typically much higher than the preferred capital gains rates and qualified dividend rates if the same savings was held in a brokerage account.
Top Hat Plans are complex, customized and can be an effective part of a benefits package for certain companies. The above information is a brief summary of Top Hat Plans and additional information can be collected by contacting NSAG.
NSAG News
Happy anniversary NSAG… Memorial Day 2023 marked the 10-year anniversary of NSAG officially opening our doors to clients. NSAG’s assets under management have grown 800% while we have continued to regularly add new staff and technology to maintain our high level of customer service. NSAG appreciates your continued trust and support.
Congratulations Forrest… Forrest Kuchling passed his Series 65 exam in May 2023. The examination is designed to qualify candidates as investment adviser representatives and covers topics that have been determined to be necessary to understand in order to provide investment advice to clients. Forrest’s continued educational pursuits are just another example of our firm’s commitment to personal growth and knowledge.
Where will the equity markets go next?
Sunday May 28th Democratic and Republican negotiators came to an agreement on proposed language to raise the debt ceiling. As expected, parties from the far left and far right have already expressed their dismay with the terms of the agreement. While the deal is not finalized until passed by Congress and Senate, it is widely expected that final rounds of negotiations will produce the necessary number of votes prior to the revised default deadline of Friday June 5. Current versions of the agreement include:
- Debt ceiling is suspended until 2025 (past the next presidential election)
- Nondefense spending will not increase in 2024 while defense spending will increase by 3%
- Return of approximately $30B of unspent Covid funds
- Minor adjustments to welfare benefits to encourage work
- Temporary reduction of $20B in new funds recently allocated to the IRS
- 50% reduction in the permitting time for new energy projects
The current economic slowdown has been widely expected and we are likely in the middle of the two worst quarters for the slowdown. We expect Q2 2023 to be the hardest part of the slowdown. Many companies that we have talked to expect their inventory to hit desired levels this summer, which will in turn begin to drive up production needs. Programs quickly put in place by the Federal Reserve have helped concerns over a global financial contagion slowly fade and refocus on the potential impacts of slower lending by regional banks. To ease the potential pressures of less lending, the Fed is already discussing a reduction or elimination of future rate hikes after May’s 0.25% increase.
We are starting to see signs that various parts of the economy are improving off their worst levels. The following is a sample list of economic indicators that we will cover in greater detail in July’s Timely Topics.
- Retail Sales
- ISM Manufacturing PMI
- ISM Services PMI
- Durable New Orders
- Industrial Production
- Home Sales/Starts
- Savings Rate
We continue to encourage clients to stay properly diversified as market volatility can be swift in both directions.
We are passionately devoted to our clients' families and portfolios. Contact us if you know somebody who would benefit from discovering the North Star difference, or if you just need a few minutes to talk. As a small business, our staff appreciates your continued trust and support.
Please continue to send in your questions and see if yours gets featured in next month’s Timely Topics.
Best regards,


Mark Kangas, CFP®
CEO, Investment Advisor Representative