


Each month we ask clients to spend a few minutes reading through our newsletter with the goal of raising their investor IQ. With banks being taken over by the FDIC and market volatility picking up, it is more important than ever for investors to understand how their bias impact their returns.
- Investors and their biases
- Impact of guarantees on returns
- Timing the market
- The FDIC can end bank runs
- Credit Suisse’s issues are different
- Where will the equity markets go next?
Traditional finance theory assumes that all investors act rationally at all times as the markets evolve, with the goals of profit-maximization and risk-aversion. The theory operates on the assumption of efficient markets, however in practice efficiency can fluctuate due to human behavior and other variables. Rarely do we see that capital markets are 100% efficient, and there are opportunities for outperformance. Why is this? Regularly, market participants and investors are unaware of behavioral finance theory, which works on the assumption that investors do not always act rationally and suffer from a variety of biases. An understanding of each bias can help us to guide investors down the correct path when building an investment plan and constructing long term asset allocations within portfolios.
Investors and their biases
Did you know that investors can be classified into five different types? Knowing what type of investor you are may help improve your portfolio’s long-term performance. We encourage you to read through following summary and email us which of the five investors you think you are. For every response we receive, we will buy a fun and interactive “Investing for Kids” book that NSAG will give out to 7-12 year olds this summer to help build their Investor IQ.
Typical biases that investors may suffer from can be classified in two major groups: cognitive or emotional. For this exercise, we will use the Bielard, Biehl and Kaiser five-way model (BB&K Behavioral Model) to classify investors, discuss the biases each investor type suffers from, and the effects those biases have on an investor’s portfolio. According to BB&K, there are main investor types: the Individualist, the Adventurer, the Celebrity, the Guardian, and the Straight Arrow. To visualize this classification scheme, see the image below.

Let’s now dissect what each classification means, the biases suffered from, and the ramifications of those biases on portfolios.
- The Individualist is confident and careful.
- Asset Allocation: Portfolios tend to have below average risk with above average expected return.
- Biases: Individualists suffer from overconfidence, confirmation and representativeness.
- Impact: Overconfidence leads to highly concentrated portfolios. Confirmation bias leads to under-diversification and incorrect analyzation of investment options. An example of confirmation bias would be to only seek data that confirms an earlier decision, while not assessing negative data. Representativeness stems from confirmation, which means a failure to update previous forecasts when new data is available. When an individualist investor combines confirmation and representativeness, they tend to hold inappropriate assets.
- The Adventurer is confident and impetuous (also known as acting quickly with less due diligence)
- Asset Allocation: Portfolios tend to have high risk and high return potential.
- Biases: Adventurers suffer from overconfidence bias and illusion of control bias.
- Impact: Overconfidence leads to investors having very concentrated portfolios which inherently increases asset correlation and risk. Additionally, this can lead to excess trading, which inherently increases transaction costs within a portfolio and causes market timing concerns. As an example, an investor who is highly concentrated to their employer’s stock would suffer from illusion of control bias.
- The Celebrity is anxious and impetuous.
- Asset Allocation: Portfolios tend to have above average risk with below average expected return.
- Biases: Celebrities suffer from regret aversion, availability, and hindsight biases.
- Impact: Regret aversion means to “do nothing,” stemming from a fear of being wrong, and this leads to long-term underperformance. Availability bias relates quality with ease of access. This leads to overreactions during financial stress, under-diversification, and a smaller universe of investment options. Hindsight bias leads investors to believe they could have accurately predicted historic events, which were highly uncertain during their time. By doing this, it leads to incorrect assessment of future market conditions.
- The Guardian is anxious and careful.
- Asset allocation: Portfolios tend to have low risk with low return potential.
- Biases: Guardians suffer from mental accounting, loss aversion, and status quo biases.
- Impact: Loss aversion leads to excess trading and holding low-quality/low-return assets for too long. Status quo bias leads to holding assets with inappropriate risk metrics and a failure to consider higher quality investment options. Mental accounting leads to higher correlated portfolios with inherently higher risk when attempting to construct a lower risk portfolio.
- The Straight Arrow: The average investor (intersection of all four primary classifications)
- As advisors, we strive to educate our clients about the financial planning, capital markets, and their own personal biases with the goal of guiding each client to be a “straight arrow” and mitigate their primary biases.
While not all biases are shown for each investor classification, we’ve made it a point to discuss the biases with the most critical ramifications for portfolios. In general, combining a well thought out investment plan with a strong discipline to stick with the plan can assist investors with avoiding or mitigating the effects of each investor’s bias.
Impact of guarantees on returns
An investor’s bias sways their decisions, which ultimately impacts how they allocate their portfolio. It is important to understand how long-term allocations have a direct impact on risk and return over time.
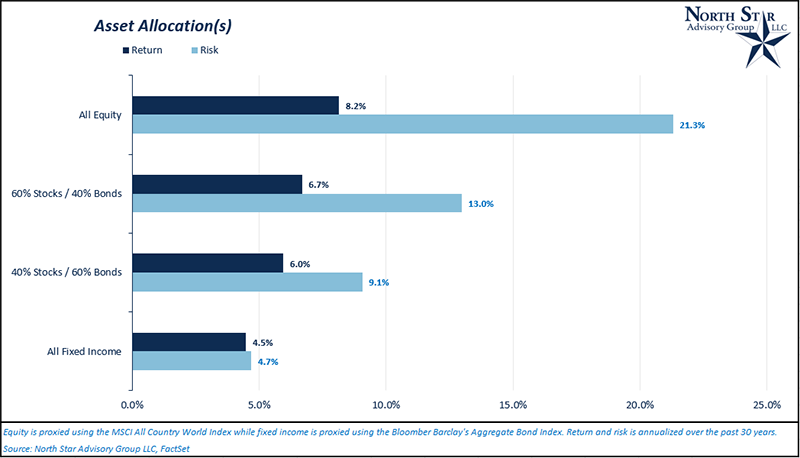
In the Asset Allocation(s) chart below, we breakdown the historical average annualized risk (measured by standard deviation) and return for different asset allocations. These four allocations include all equity (100%), 60% equity / 40% fixed income, 40% equity / 60% fixed income and all fixed income (100%).
- Adventurers tend to build their portfolio with an all-equity allocation.
- Individualists tend to build their portfolio with an allocation that falls between 60/40 to all equity.
- Celebrities tend to build their portfolio with an allocation that falls between 40/60 to all equity.
- Guardians tend to build their portfolios with an allocation that falls between all fixed income and 40/60.
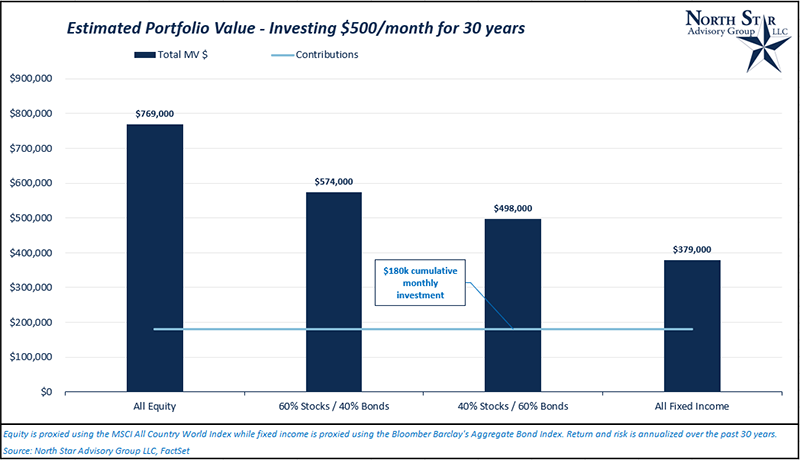
Focusing attention back to the risk and return assumptions for each of the four asset allocations, we can illustrate how portfolio values are impacted by allocation decisions. For this estimation, we will invest $500/month for 30 years into a portfolio with each asset allocation. In the Estimated Portfolio Value chart, we can visualize the hypothetical ending market value for each portfolio. Looking at either end of the spectrum, the all equity ending portfolio value was $769,000 while the 100% fixed income allocation ending value was $379,000. That is a $390,000 difference. So, while equities may be a more volatile asset class, they are a crucial asset class when constructing long-term asset allocations for clients.
Lately, we’ve fielded a lot of questions from clients regarding guarantees provided by various annuity products. The allure of products being advertised with “no exposure to down markets,” is enough to make any investor curious. Annuity products are created with a variety of different structures and rules that are utilized to reduce their risk profiles. What investors and many advisors often miss is that the same structures that reduce risk also significantly reduce returns. In the end, NSAG’s analysis shows the annuity’s return profile more closely match that of fixed income vs equities. From NSAG’s point of view, this is why annuities may sometimes make sense as a replacement for fixed income, but rarely do we see a scenario where an annuity can be used as a viable replacement for equities. Typically, we see interest in these products from clients who are guardians.
Timing the market
Sticking with our investor bias topic, regret aversion (AKA: “Fear of being wrong”) leads a lot clients toward attempts at timing the market. We’ve written about timing the market in July 2021 and December 2021 Timely Topics.
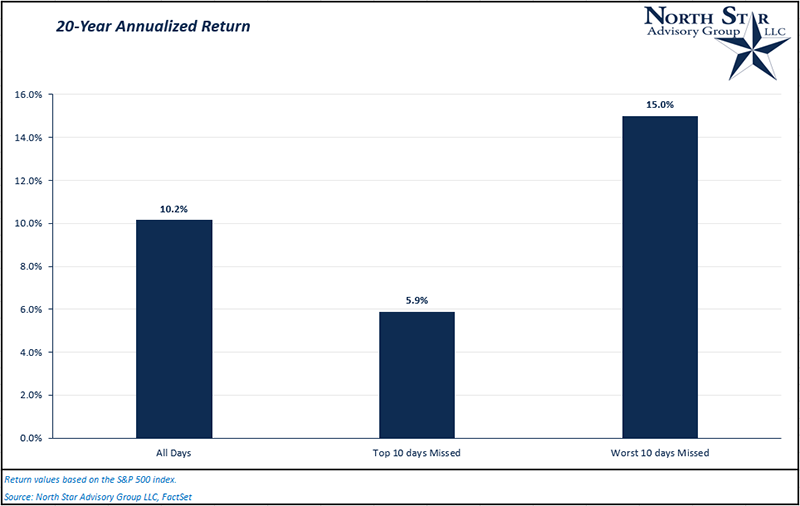
Attempting to time the market is very difficult, and it can be detrimental to returns if you miss out on just a few of the larger positive days in the equity markets. In the 20-Year Annualized Return chart, we can visualize the impact on return from missing the 10 best days or the worst 10 days over the past 20 years. When missing the 10 best days, annualized return drops from 10.2% to 5.9%. On the other hand, missing the 10 worst days increases your annualized return to 15%. It is much easier to miss out on the best days due to biases. As the markets go through their cycles, the best days tend happen right around the end of a bear market or after a larger correction. During these high volatility time periods, we see investors either hesitant to enter the market or capitulating and selling their equity. This is the definition of “selling at the worst time.” Generally speaking, NSAG is currently hearing a large amount of bias towards avoiding the market.
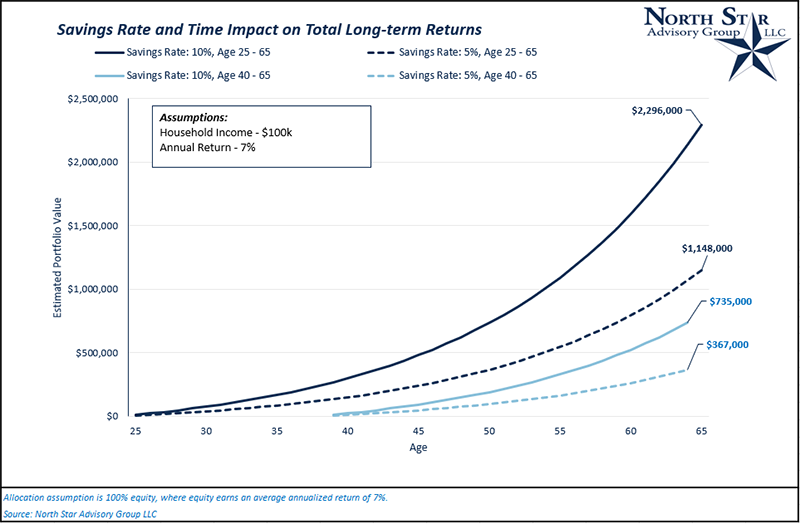
Time in the market is another important factor to consider when investing. “Time in the market” is different from “timing the market,” although, attempting to time the market can lead to long periods of time where an ivestor is out of the market. In the following Savings Rate and Time Impact chart, we compare the effect of waiting and the amount being saved on the estimated future portfolio value. In this chart, we assume a 7% annualized return for a household who earns $100,000 annually. The variables are annual savings rate (%) and the number of years investing.
The FDIC can end bank runs
On March 10, 2023 the FDIC seized Silicon Valley Bank (SVB). SVB was America's 16th largest bank, ranked by deposits, based on U.S. Federal Reserve data. The bank’s failure is the largest since 2008. There was considerable concern that depositors above the FDIC’s insurance limit of $250k would incur losses.Silicon Valley Bank was founded in 1983 by two former Bank of America managers to focus on the needs of startup companies. SVB grew over the past 40 years by starting as a commercial bank that took deposits from these venture-backed companies. As SVB grew, they found it more lucrative to start being a venture capitalist themselves. With direct access as a VC firm, additional returns could be achieved potentially by purchasing equity in some of the startups they backed. Throughout their deals, SVB requested or required the companies they funded to bank exclusively with SVB.
In 2020, the Federal Reserve lowered interest rates to combat COVID. SVB (and a few other banks) started buying longer-term US Treasury securities with the cash that their clients had given them for short-term deposits. This reach to longer maturing bonds created higher returns to SVB.
In 2022, two major events occurred. Firstly, the revenue for many of the technology startups that either banked with and/or were funded by SVB started to decline. Disregarding their lower revenue, many of these same companies continued with their normal spending patterns, which caused them to start pulling down their cash reserves at SVB. Secondly, the Federal Reserve raised interest rates extremely fast to offset inflation, which caused the longer-term US Treasury bonds that SVB (and a few other banks) purchased to decline in value by anywhere from around 9 to 31%. In 2022, 5-year, 10-year, and 20-year treasuries declined 9.5%, 15%, and 31%, respectively.
In early March 2023, SVB scared investors when it announced that it sold off treasuries at a loss to cover customer withdrawals. Prior to this sale, SVB was allowed by regulations to carry the value of the US Treasury bonds on their balance sheet at Par value, even though they were worth much less. This announcement caused Peter Thiel to advise his venture capital firm Founders Fund and their portfolio of companies to pull all of their funding and deposits from SVB on March 9, 2023. This caused a digital bank run exactly 14 years since the market bottomed during the Global Financial Crisis. SVB customers withdrew $42 billion in a day and the bank fell underwater.
The FDIC responded on Sunday March 11 by announcing that all deposits at SVB as well as New York’s Signature Bank (SBNY) were fully guaranteed under an exception to the $250k deposit insurance cap known as a systemic risk exception designed to stem high-level crises in the banking system beyond a single institution. In both cases, no losses associated with the resolution of SVB will be borne by the taxpayer; any cost to the deposit insurance fund will be recouped via a special assessment on banks in aggregate. Non-deposit debt holders and equity in the banks will be wiped out. The top executives and boards of both companies have been fired.
Ironically, Barney Frank has been on the board of directors for SBNY since 2015. Frank’s name may be familiar since he was a co-sponsor of the most far reaching Wall Street reform in history, Dodd-Frank Act was passed July 21, 2010 to prevent the excessive risk-taking that led to the financial crisis. The law also provides common-sense protections for American families, creating new consumer watchdog to prevent mortgage companies and pay-day lenders from exploiting consumers. Just let that sink in for a few minute.
A coalition of midsize U.S. banks, Mid-Size Bank Coalition of America (MBCA), has asked regulators to extend FDIC insurance to all deposits for the next two years, Bloomberg News reported citing an MBCA letter to regulators. The letter argued that extending insurance will immediately stop the exodus of deposits from smaller banks, which in turn will stabilize the banking sector and restore confidence in banking system, the report said.
On March 21, 2023 the US Treasury Secretary Janet Yellen said the government is ready to provide further guarantees of deposits if the banking crisis worsens. A report from Bloomberg indicated that “regulators are studying a way to guarantee all deposits. One idea that has been floated has been to offer a tiered pricing system in which depositors would pay extra to guarantee deposits above $250,000.”

Credit Suisse’s issues are different
The media is incorrectly hyping the issues of Credit Suisse as “banking problems are spreading across the globe.” The company has been plagued by a series of missteps and compliance failures in recent years that cost it billions and led to several overhauls of top management. And over the past decade, the Swiss bank has been hit with fines and penalties related to tax evasion, misplaced bets and other issues. It would be incorrect for any media source to insinuate or allude that Credit Suisse’s problems are similar to, or caused by, SVB. Here is why:In 2014, Credit Suisse pleaded guilty to federal charges that it illegally allowed some U.S. clients to evade their taxes. The bank paid a total of $2.6 billion to the federal government and New York financial regulators as part of the settlement.
In 2019, Credit Suisse was the underwriter for Luckin Coffee when it went public on the Nasdaq. The bank’s reputation was damaged by an accounting scandal at Luckin Coffee which led to the stock being pulled off the US exchange after Luckin fraudulently inflated sales.
In 2020, Credit Suisse’s CEO resigned after two high-profile spying scandals involving top bank officials.
In 2021, An independent external investigation found that Credit Suisse allowed Archegos Capital to take “voracious” and “potentially catastrophic” risks that culminated in the US hedge fund’s spectacular collapse. Credit Suisse lost $5.5 billion and further damaged their reputation.
In 2022, the bank was hit by social media speculation (similar to SVB) that it was on the brink of collapse, leading customers to withdraw billions of dollars. The larger and faster withdrawals made profitability a near impossibility for the bank, which had already been hemorrhaging money for years.
In February 2023, Credit Suisse’s stock price hit record lows after it posted its biggest annual loss since the financial crisis in 2008 and a report surfaced that regulators were reviewing comments Credit Suisse’s chairman made about the health of its finances.
SBV’s issues were uncovered here in March 2023.
On March 19, 2023, UBS bought Credit Suisse for 3 billion Swiss francs ($3.2 billion) in an all-stock deal, as regulators look to shore up Credit Suisse before their collapse puts pressure on the global banking system. To assist UBS in the deal, the Swiss National Bank also pledged a loan of up to 100 billion Swiss francs ($108 billion) to support the takeover. The final negotiated take-over price translates to another 60% decline over the weekend from Credit Suisse’s last traded price on March 17!
Where will the equity markets go next?
Mark’s thoughts on predicting a recession
Over the past three years, the commentary that a recession is looming has been fairly constant. The media, experts, and even clients I speak with share a high degree of certainty that a recession is 3, 6 or 9 months out, given a set of criteria. Meanwhile, the predicted dates have come and gone, and many of the predicted criteria have not come to fruition. Even as several new concerns have arisen, they are likely not the cause of the next great recession either. While the probability of a recession has risen over the last month, it is not a forgone conclusion that we will have a recession – and if we do have a recession – that it is going to be a bad one or a long one.
In fact, we may continue to see many smaller “rolling recessions” or “brown outs” in certain sectors of our economy as other areas continue to slowly move forward in a world rebooting post-Covid. While the daily concerns of Covid are starting to diminish, Covid’s impact on labor dislocations, supply chains, and monetary and fiscal policy, will be felt for years to come. Some economic areas are significantly improving, but are not discussed by the media, while other areas that are struggling can become this week’s headlines. Just this weekend, I talked to a manager at a tech company in Chicago that has finally been able to fill open positions with new hires that were recently let go from other well-known tech companies.
Looking back, bad recessions tend to be black swan events that virtually no one predicted. If the masses and media are predicting a recession is headed our way in 3-6 months, it is probably not going to happen in 3-6 months. One will eventually happen though.
You might have heard me reference Covid as a boulder thrown in the large economic pond. The initial shock waves are the largest, smaller ripples continue for a long time. Each successive ripple can also be different and hit differently as well. We continue to expect the markets to stay volatile through most of 2023 as investors try to predict and trade around the “looming recession.”
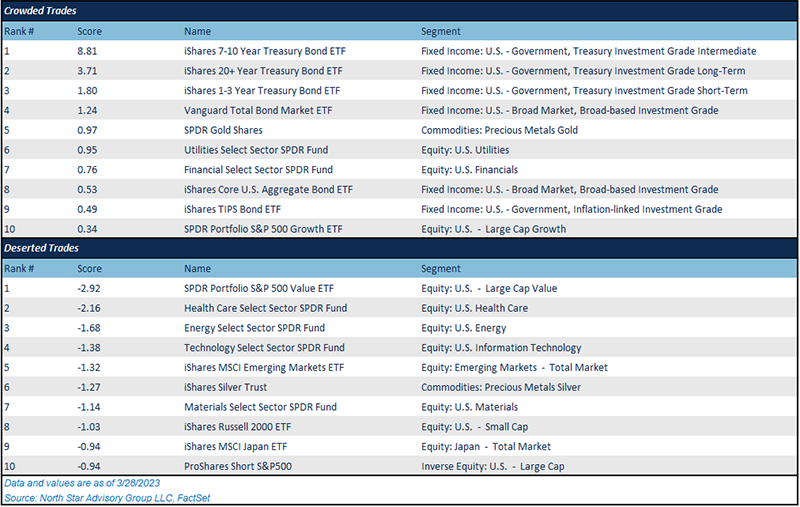
We continue to encourage clients to stay properly diversified. Out of curiosity, we evaluated all ETFs trading in the US over the last three months. After providing more weight to the most recent month, we broke the list into what we call “Crowded Trades” and “Deserted Trades.” Crowded trades are ranked in order by most inflows into the ETFs, while deserted trades rank the top ETFs with outflows. Six of the top ten crowded trades are bond funds and you can get a seventh “safety trade” if you add the gold ETF. A crowded list like this is not likely to last for long and demonstrates the capitulation that we are currently hearing from investors. Many of the best performers in 2022 have been temporarily abandoned in 2023. Both of these lists are likely to reverse course if things start to stabilize and the concerns of a banking crisis start to diminish.
We are passionately devoted to our clients' families and portfolios. Contact us if you know somebody who would benefit from discovering the North Star difference, or if you just need a few minutes to talk. As a small business, our staff appreciates your continued trust and support.
Please continue to send in your questions and see if yours gets featured in next month’s Timely Topics.
Best regards,


Mark Kangas, CFP®
CEO, Investment Advisor Representative