


Each month we ask clients to spend a few minutes reading through our newsletter with the goal of raising their investor IQ. This month, we deeply expand on business cycles, GDP and inflation, picking up where we left off in May’s Timely Topics’ section, “GDP Reading 401.”
- Business Cycles / Mean Reversion
- Recessions
- GDP – Contribution and Breakdown
- Inflation - Contribution and Breakdown
- S&P Price Targets
- Where will the equity markets go next?
Business Cycles / Mean Reversion
The term Business Cycle is used to describe very broad shifts and movements in the overall economy. Each cycle is unique and is comprised of different durations, expansions and contractions. Let’s take a further look at business cycles and how the economy has continued to expand in spite of contractions over the past 75 years.
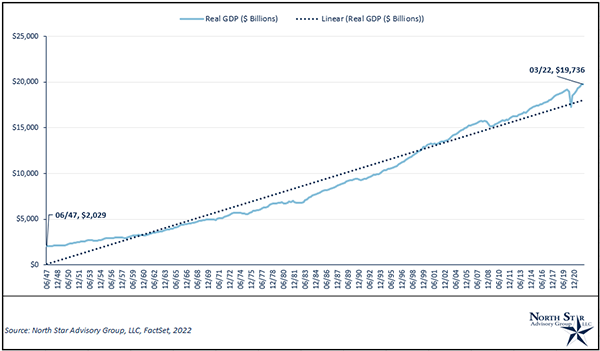
On average, U.S. real GDP is expected to grow at a long-run annual rate of 3.13% (North Star Advisory Group LLC, FactSet 2022). Although, if we were to project annual GDP growth over the next 20 years, it’s highly unlikely (virtually impossible) to realize an exact 3.13% growth rate each year. It’s most likely that we fluctuate above and below the average level over long periods of time. This phenomenon is known as “mean reversion,” and it is seen throughout various areas of the broader capital markets, such as EPS, Valuation Levels (P/E, P/S, etc.), book value, and much more. We’ve displayed this phenomenon in our example, which can be seen in Chart 1 below, which represents annual real GDP growth over the past 75 years. There are four primary stages of a business cycle: Expansion, Peak, Contraction, and Trough. All four of these stages are realized throughout the “mean reversion” process. Expansions are characterized by a continued acceleration of growth over multiple periods. Peaks are formed by a slowdown in an expansion’s acceleration rate. Contractions are characterized by decelerating growth and eventual negative growth rates. Finally, troughs are characterized by flat and accelerating growth rates following a contraction (Expansion -> Peak -> Contraction -> Trough -> Expansion). Luckily for capital market participants, economic growth, EPS, firm book values, etc. all display the 8th wonder of the world, compounding. When that average rate growth rate is compounded over long periods of time through multiple business cycles, your result can be seen in Chart 2.
There are pockets of disruption around the globe due to China’s temporary lockdowns and the Russia/Ukraine war. As expected, the rate of economic acceleration is slowing down. However, the overall economy has not (yet) moved into negative growth.
Chart 1
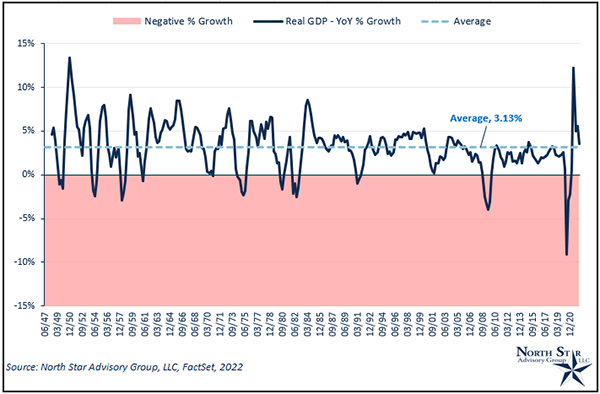
Chart 2
Recessions
Talk of recessions is driving fear into investors. This fear can even be seen through Google analytics, which shows recent searches for the word, “recession,” are hitting peak levels. For this reason, we dive into the definition and varieties of a recession.
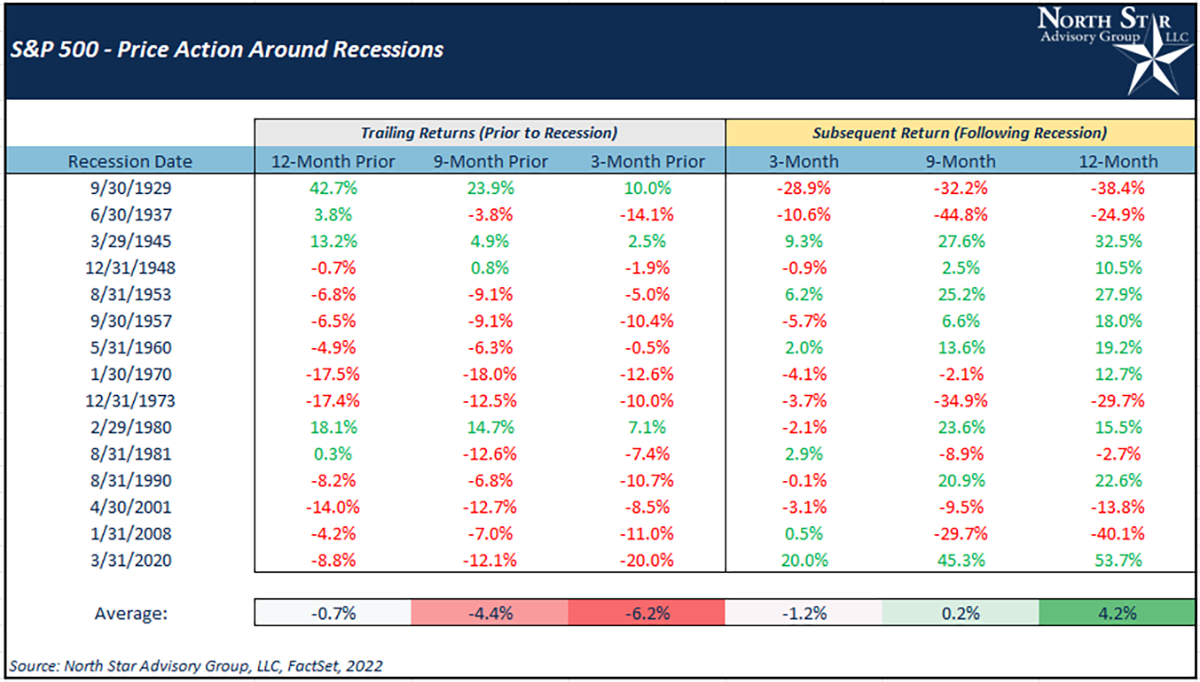
Recessions are generally defined as multiple sequential periods (minimum of two quarters) of economic contraction or slowdown accompanied by a rise in the unemployment rate. So, what level of a slowdown is technically considered a recession? Typically, a minimum of two consecutive quarters with a negative annualized GDP growth rate indicates that the economy is in a recession. Recessions are more likely to occur during the contraction and trough stages of a business cycle. From a market standpoint, equity assets have historically been a leading indicator since they are generally forward looking over the next 9-12 months. With that being said, let’s examine the price action of the S&P 500 (as our market proxy) during periods before and after recessions. Referencing Table 1, we examine price movements on the S&P 500 during the prior three months leading into the first quarter of a recession, and the price action during the following 12 months. With simply looking at the scaled-color formatting, you’ll notice that a majority of the time, the market will sell off during the recent months leading into a recession. Remember, the stock market is a leading indicator. Looking at the performance through the following 12 months, the majority of price action is positive except for notable outliers in 9/30/1929 (The Great Depression), 6/30/1937 (Great Depression Runoff), 12/31/1973 (Vietnam War, OPEC Oil Prices/U.S. Oil Embargo), and 1/31/2008 (Global Financial Crisis), which were all severe recessions. While the likelihood of a recession is rising, the probability remains low, and the potential depth of a recession is likely shallow.
Table 1
Real Gross Domestic Product (GDP) – Contribution and Breakdown
If a recession is caused by two negative quarters of GDP, what is GDP? Real GDP is the total monetary value of all finished goods and services within a specific time frame (typically, annualized and measured quarterly). GDP can be measured by its components with the basic equation: GDP = Consumption + Investment + Government Spending + Net Exports.
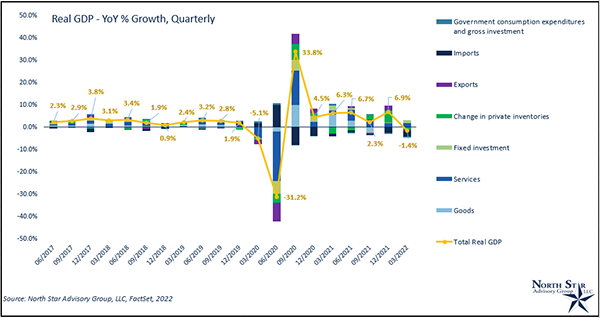
On April 28, 2022, the U.S. recorded its first negative Quarter-over-Quarter growth since March 2020. Historically, it’s normal for the U.S. to run a trade deficit (negative net exports), but for Q1 2022, this deficit grew more than normal along with a slight decrease in gross investment. In the Q1-2022, the U.S. dollar strengthened against many foreign currencies (+3.53% versus the Euro from 12/31/2021 – 3/31/2022). A stronger USD makes importing more expensive for the foreign country importing from the U.S., and less expensive for the U.S. to import from foreign countries. Looking past these 1st Quarter GDP numbers, persistent inflation and rate hikes are areas of concern moving forward. Higher prices could potentially lead to a slowdown in consumption, while tighter monetary conditions could potentially slow private investment (less corporate spending, capital expenditures, etc…). In Chart 3 below, we examine the individual component contribution to real GDP over the past two years. We’ve broken out consumption into goods and services, net exports into imports and exports, and investment into fixed investment and change in private inventories. In the most recent quarter, Q1-2022, we confirm that a decrease in exports, private inventories, and goods were the primary drivers of the -1.4% print.
Chart 3
Transitory Inflation
Inflation has been a primary topic of discussion over the past 12 months. The Federal Reserve has a Dual Mandate to maintain price stability (inflation) and achieve maximum employment. Focusing on price stability, the Federal Reserve’s inflation goal is to have a long-run inflation to run at a 2% rate with upper and lower limits +/- 1% around the 2% target. Over the past 40 years, the U.S. has actually realized an average annual inflation rate of around 2.8% based on core CPI. This has been 0.2% lower than the Fed’s upper limit. Next, we break down how transitory inflation is real and may lead us back to normal inflation rates.
Recently, we’ve experienced accelerated inflation well above the Fed’s target, caused by overly easy, covid-fueled monetary policy, supply chain shocks, and strong overall demand. As mentioned in the Real Gross Domestic Product section, above average inflation could potentially lead to lower consumer spending, a key component (consumption) in our GDP calculation. A word that we’re sure many people have heard is transitory, which simply means not permanent. While overall inflation has not yet proven to be transitory, there are certainly components whose prices have been historically volatile and have displayed transitory traits.
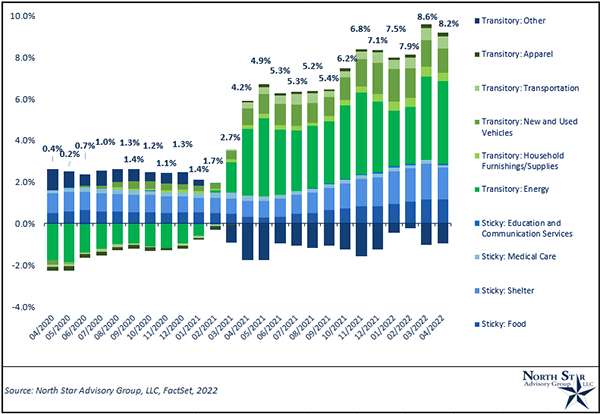
For example, energy alone contributed to half of March and April’s 8.6% and 8.2% respective inflation prints (becoming the largest contributor). Energy prices are highly transitory, for example, oil and gas companies operate in a perfectly competitive global market structure where they operate as price takers, meaning they have no pricing power. One company can’t charge more for a gallon of gas than the next company given that the product (gas) is not differentiated in any way. These companies take the price set by supply/demand in the market. So, over time, current prices are not sticky or permanent. In fact, we may see falling energy prices contribute to deflationary pressures soon. The same deflationary pressure is expected from the new and used auto market.
Overall, in Chart 4, we examine the contribution of primary components to inflation (CPI – All Items). On average, over the past two years, transitory components have added 1.9% to CPI inflation, while in 2022, they’ve added 5.1% on average.
*Chart note: green colorways indicate transitory, while blue colorways indicate sticky.
Chart 4
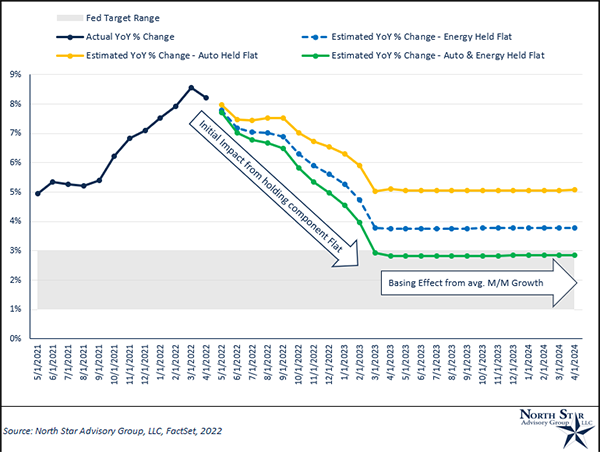
Now, to put the impact of transitory prices in perspective, we’ve ran a “What-if?” analysis on potential YoY % CPI over the next two years. By doing this specific analysis, we demonstrate the basing effect of YoY price changes. For this analysis, we grew each CPI component at their one-year average monthly growth rate over the next two years. As an exception, we held energy prices flat and used each component’s current CPI weight. Using these assumptions, we then project YoY % growth in CPI over the next two years. Again, this is an estimate assuming energy prices remain flat from current level and the remaining CPI components grow at their one-year average month over month. Even at this elevated average rate, we eventually base out at a YoY % growth of ~3.75%. In chart 5, we visualize the initial impact of flat energy prices and the eventual basing effect of price increases. Lastly, we ran the exact same scenario two more times; holding just auto prices flat and then holding both auto and energy prices flat. After reviewing the green line in chart 5, “Both Auto and Energy Prices held flat,” the basing effect of inflation leads us right within the Fed’s target inflation parameters of 2% (+/-1%) aka 1-3%.
Chart 5
S&P 500 – Price Targets
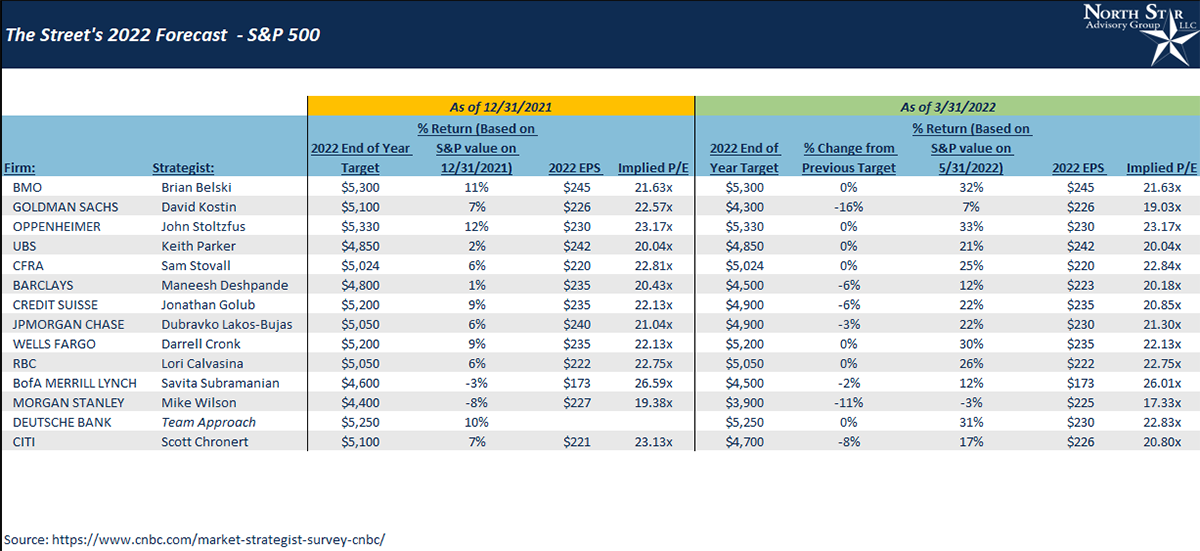
In January 2022’s Timely Topics, we looked at various Wall Street firms and their respective S&P 500 price targets for 2022. Where do those targets stand now, and how accurate were they five months into the year? Let’s examine below. From 12/31/2021 – 3/31/2022, 7/14 firms revised their S&P 500 price target downward, and the remaining seven have left their target unchanged. Based on revised targets, the average and median price target on the Street is $4,836 and $4,900, respectively. Previously, the average and median price target was $5,018 and $5,075, respectively. While the year is far from over, the Street does not appear to be on track for their initial or revised price target, excluding Mike Wilson at Morgan Stanley.
Historically, the Street has not been extremely accurate regarding their price targets on the S&P 500. Typically, we see analysts revise their targets based on short-term actual price action on the S&P 500. Price targets tend to lag behind and follow the actual price, especially during larger corrections/drawdowns in the overall market. Over the past 20 years, actual price and average target price have displayed a monthly tracking error* of 147 points. On average, the aggregate S&P 500 price target has been off by +/- 14.8% measured monthly.
*Tracking error is the standard deviation of the difference between actual and estimated price.
Table 2
Where will the equity markets go next?
After seven consecutive losing weeks for the S&P 500, the index managed to close higher for the last week of May. And it was quite the move with S&P 500 up more than 6% for its best one-week gain since the first week of November 2020 (election week). Looking for further insights into the move, we noticed that the market also traded higher during regular trading hours, from the open to the close on all five trading days this week as well, which signifies a sentiment-driven rally with FOMO (fear of missing out) buyers rushing into stocks intraday. In S&P 500’s history since 1993, there have been 50 other weeks where it gained from the open to the close on all five trading days of a week. But this was the first time we’ve seen S&P 500 post intraday gains all five days during the week with four of those gains being 1% or more.
2022’s correction has been broadly due to fears of an economic slowdown caused by the Federal Reserve’s tight monetary policy, China’s closure due to their zero Covid policy and the ripple effects of Russia’s invasion of Ukraine. While there are fears of a possible recession, most Wall Street firms don’t believe that a recession is 100% likely and/or a potential recession could be short and shallow. That being said, gauging the economy has been very difficult and everyone has their eye on The Federal Reserve for a potential policy mistake which could throw the US (and world) into a deep and/or protracted recession. Just look at the caution that Jamie Dimon presented just a week apart.
Jamie Dimon, JP Morgan’s CEO provided the following outlook on 5/23/2022:
“I’m calling it storm clouds because they’re storm clouds. They may dissipate. If it was a hurricane, I would tell you that – or a tsunami, like we had in ’07 or ’08.”
“If we go into recession, it may be different to prior recessions,” he said, adding JPMorgan will withstand a range of scenarios. “We’re not wishful thinkers. Obviously, we want it to turn out well, but we can handle all of that.”
Jamie Dimon, JP Morgan’s CEO provided the following updated outlook on 6/1/2022:
“You’d better brace yourself,” Dimon told the roomful of analysts and investors. “JPMorgan is bracing ourselves and we’re going to be very conservative with our balance sheet.”
“Right now, it’s kind of sunny, things are doing fine, everyone thinks the Fed can handle this,” Dimon said. “That hurricane is right out there, down the road, coming our way.”
While it appears that Dimon is still not expecting a ’07 or ’08 tsunami, he is cautioning against a potential storm brewing.
With everything being said, it is important to note that unemployment remains low and other indicators aren’t yet pointing to a slow consumer. Consumers are just shifting their expenditures to other parts of the economy (travel, eating out, energy…).
We still believe we are in a secular bull market, which started in 2010 and typically lasts around 15-20 years. However, this secular market is likely to last longer due to a slow start in 2010-2013. It is not uncommon to have bear market pullbacks inside of longer secular bull markets. We saw a bear market in 2020 due to COVID and the markets entered and exited bear market territory in May 2022.
Many bank CEOs agree with our April commentary that the consumer remains strong with high cash levels and a strong balance sheet.
We are passionately devoted to our clients' families and portfolios. Let us know if there’s somebody who would benefit from discovering the North Star difference, or if you just need a few minutes to talk. As a small business, our staff appreciates your continued trust and support.
Please continue to send in your questions and see if yours gets featured in next month’s Timely Topics.
Best regards,


Mark Kangas, CFP®
CEO, Investment Advisor Representative